
“Bitcoin is already the global reserve asset. Anyone can buy or sell virtually any amount of BTC at any time in any country on any device for a known price without any necessary intermediary. Nothing else is like this.”
Balaji Srinivasan, December 20, 2024
“I am not “bearish” on the price of bitcoin: one cannot be bearish on a bubble since by definition it can be explosive (both ways). I am “bearish” on the concept and the use of something fragile as investment.”
Nassim Nicholas Taleb, May 20, 2024
“I’m on the bubble side, on net,” Asness said on CNBC’s “Money Movers” on Monday. “To move me off that, you really need not a price change, but a use case. That’s what could convince me to become maybe more of a crypto person when I find any use for it, aside from speculation and criminality.” Asness said there are three uses for crypto that he has identified: speculation, use in war-torn countries and paying cyber ransom.
Cliff Asness, AQR,Jan 13, 2025
“I’m not against crypto. You know, bitcoin itself has no intrinsic value. It’s used heavily by sex traffickers, money launderers, ransomware…I just don’t feel great about bitcoin. I applaud your ability to wanna buy or sell it. Just like I think you have the right to smoke, but I don’t think you should smoke.”
Jamie Dimon, CEO JP Morgan Chase, CBS Sunday Morning,Jan 12, 2025
Below are some of the indices we track.
| Data Series | 3 Months | 1 Year | 3 Years | 5 Years | 10 Years |
| Russell 3000 | 2.63% | 23.81% | 8.01% | 13.86% | 12.55% |
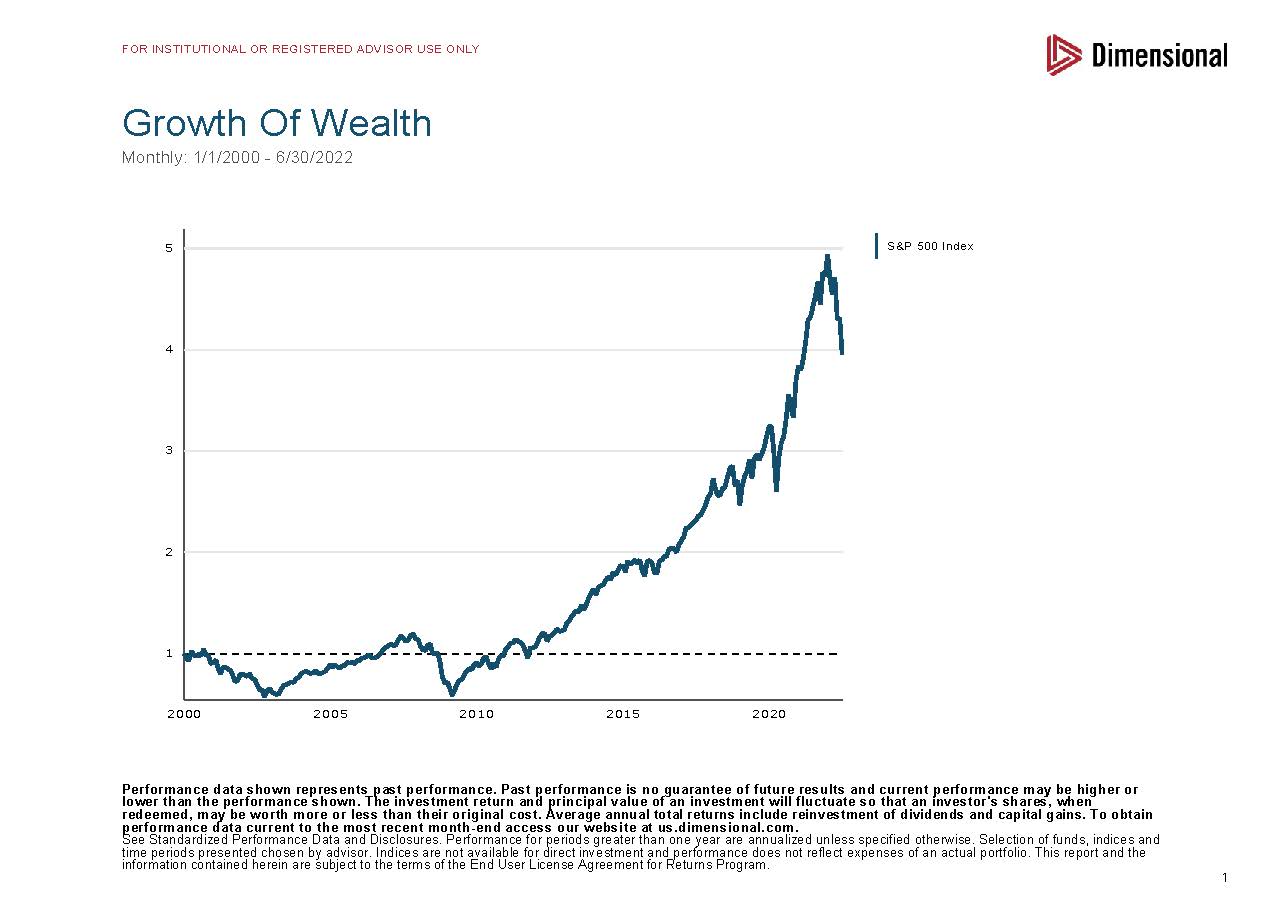
| S&P 500 | 2.41% | 25.02% | 8.94% | 14.53% | 13.10% |
| Russell 2000 | 0.33% | 11.54% | 1.24% | 7.40% | 7.82% |
| Russell 2000 Value | -1.06% | 8.05% | 1.94% | 7.29% | 7.14% |
| MSCI World ex USA (net div.) | -7.43% | 4.70% | 1.91% | 5.10% | 5.26% |
| MSCI World ex USA Small (net div.) | -7.86% | 2.76% | -2.77% | 2.87% | 5.49% |
| MSCI Emerging Markets (net div.) | -8.01% | 7.50% | -1.92% | 1.70% | 3.64% |
| Bloomberg U.S. TBond 1-5 Years | -0.83% | 3.30% | 0.63% | 1.00% | 1.33% |
| ICE BofA 1-Year US TNote | 0.70% | 4.75% | 2.78% | 2.01% | 1.63% |
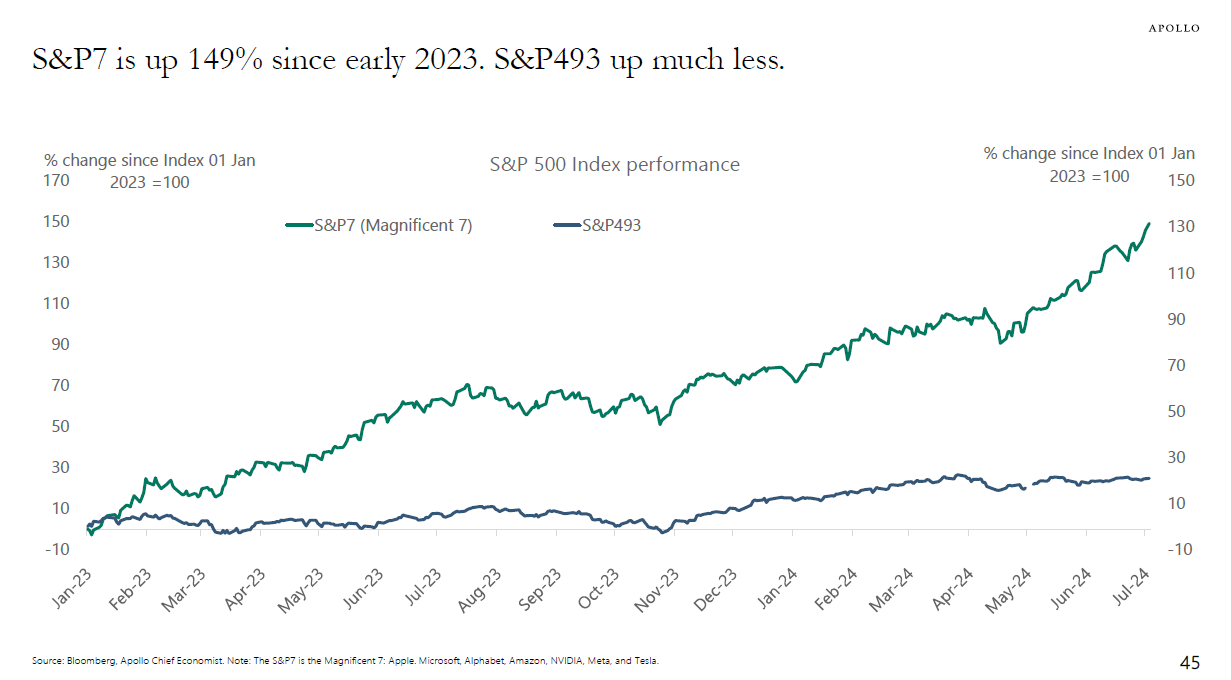
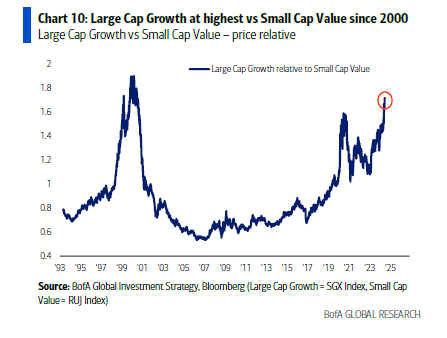
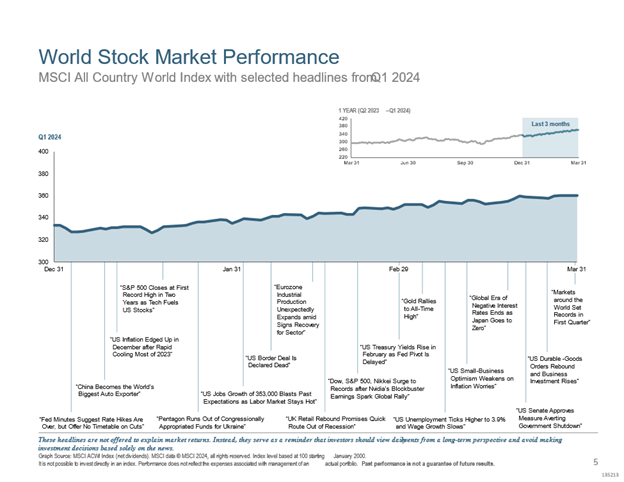
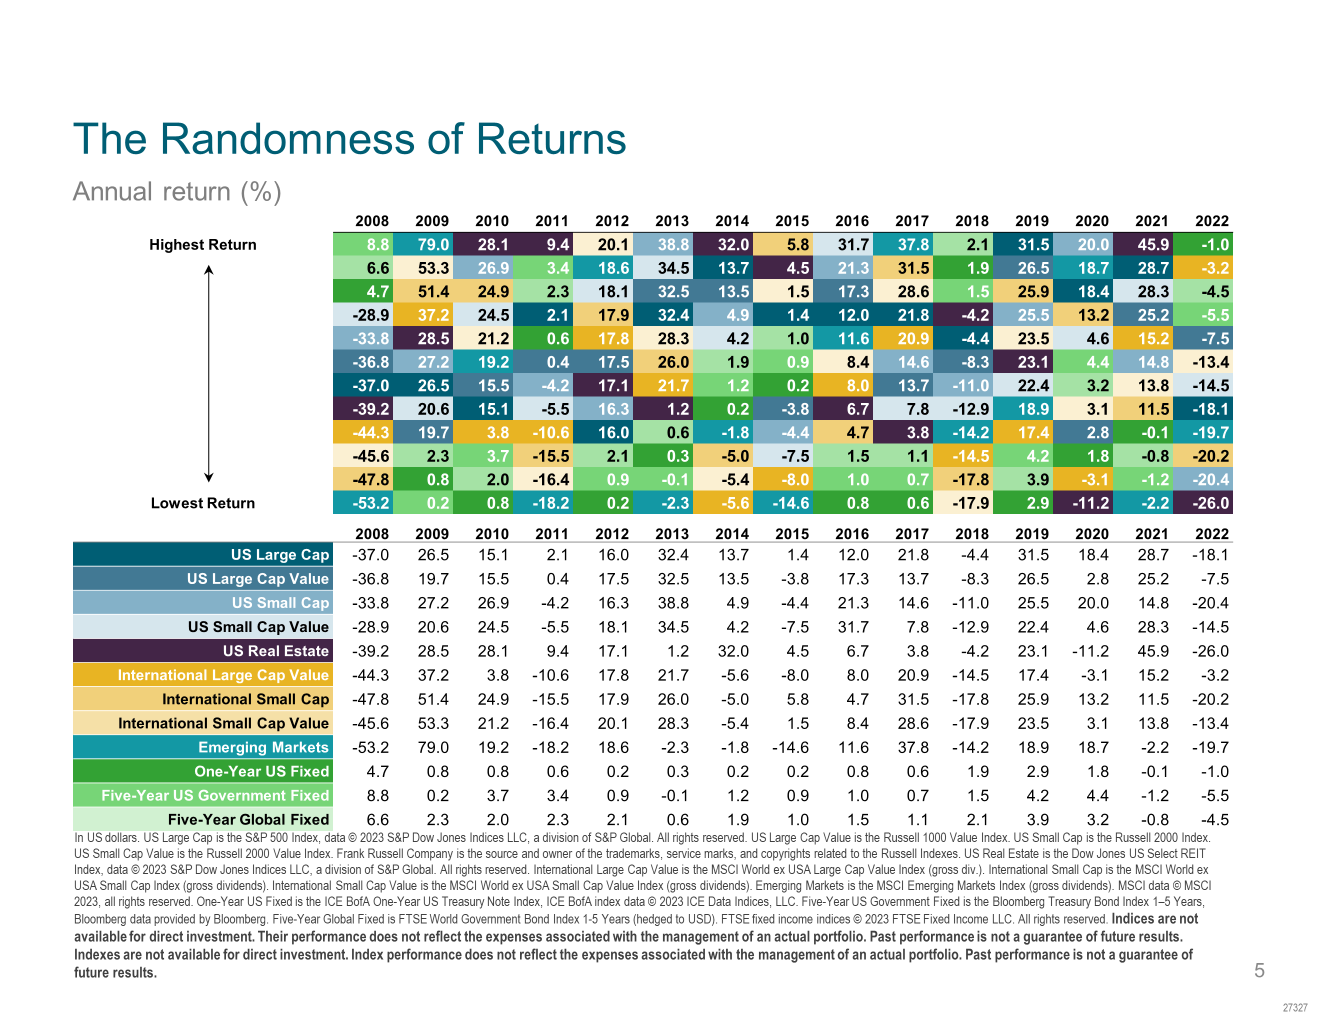
In the US stock market, we saw some positive momentum with the broad market posting a 2.63% return for the quarter, outperforming both international developed and emerging markets. Small caps struggled relative to their larger counterparts, with small value declining 1.06% while small growth managed a modest 1.70% gain, and large growth handily beat large value.
The international markets told a different story in Q4, with developed markets outside the US posting negative returns of -7.43%. Value stocks in international markets actually held up better than growth stocks, showing a reverse pattern from the US market. Emerging markets had an even tougher quarter, declining 8.01%. Most emerging market countries saw negative returns, though there were some bright spots – Israel, the UAE, and Colombia managed to post positive returns for the quarter.
The bond market faced some challenges as interest rates generally increased during the quarter. The US bond market declined, while the global bond market excluding the US managed a small positive return of 0.74%. Within the US Treasury market, we saw some interesting yield curve movements – while the 1-Month Treasury Bill yield decreased by 53 basis points to 4.40%, longer-term rates increased significantly, with the 10-Year Treasury yield rising 77 basis points to 4.58%.
Bitcoin and Your Portfolio: What You Need to Know
We’ve been getting a lot of questions about Bitcoin (and other cryptocurrencies) lately, and we want to share our thoughts with you. It’s important to us that you understand both the opportunities and risks of any potential investment, especially when it comes to something as widely discussed as Bitcoin. Although I don’t necessarily agree with Jamie Dimon that it is a Ponzi scheme, I do think there are significant issues “investing” in bitcoin.
What Exactly is Bitcoin?
Let’s start with the basics. Bitcoin is the world’s most well-known cryptocurrency, and it’s been making headlines for years now. According to the paper Speculation or currency? Multi-scale analysis of cryptocurrencies—The case of Bitcoin:
“Cryptocurrencies, also known as virtual currencies, are digital assets that leverage cryptography to ensure secure transactions and regulate the creation of new units. Unlike traditional currencies, cryptocurrencies operate on a decentralized network structure based on blockchain technologies. This means that there is no central authority controlling the issuance and transfer of these currencies, and there is no limit to how much can be transferred between parties within the network.”
In the paper Bitcoin: Medium of exchange or speculative assets?:
“Bitcoin is defined as digital money within a decentralized peer-to-peer payment network. It is a hybrid between fiat currency and commodity currency without intrinsic value and independent of any government or monetary authority.”
To put its size in perspective, Bitcoin’s total market value is currently about $1.9 trillion – that’s less than half of Apple’s value and about 2% of the global stock market. While that’s certainly significant, it’s still a relatively small piece of the global financial puzzle.
Proponents of Bitcoin
Proponents of Bitcoin primarily argue that it serves as a decentralized, borderless store of value and medium of exchange that exists outside the control of any government or central bank. They view Bitcoin as “digital gold” that can protect against inflation and currency devaluation since it has a fixed maximum supply of 21 million coins. Bitcoin advocates also emphasize its potential to provide financial services to the unbanked, enable near-instant global money transfers without traditional banking intermediaries, and offer a transparent, immutable ledger of transactions that can’t be manipulated by any single entity.
Investment or Speculation?
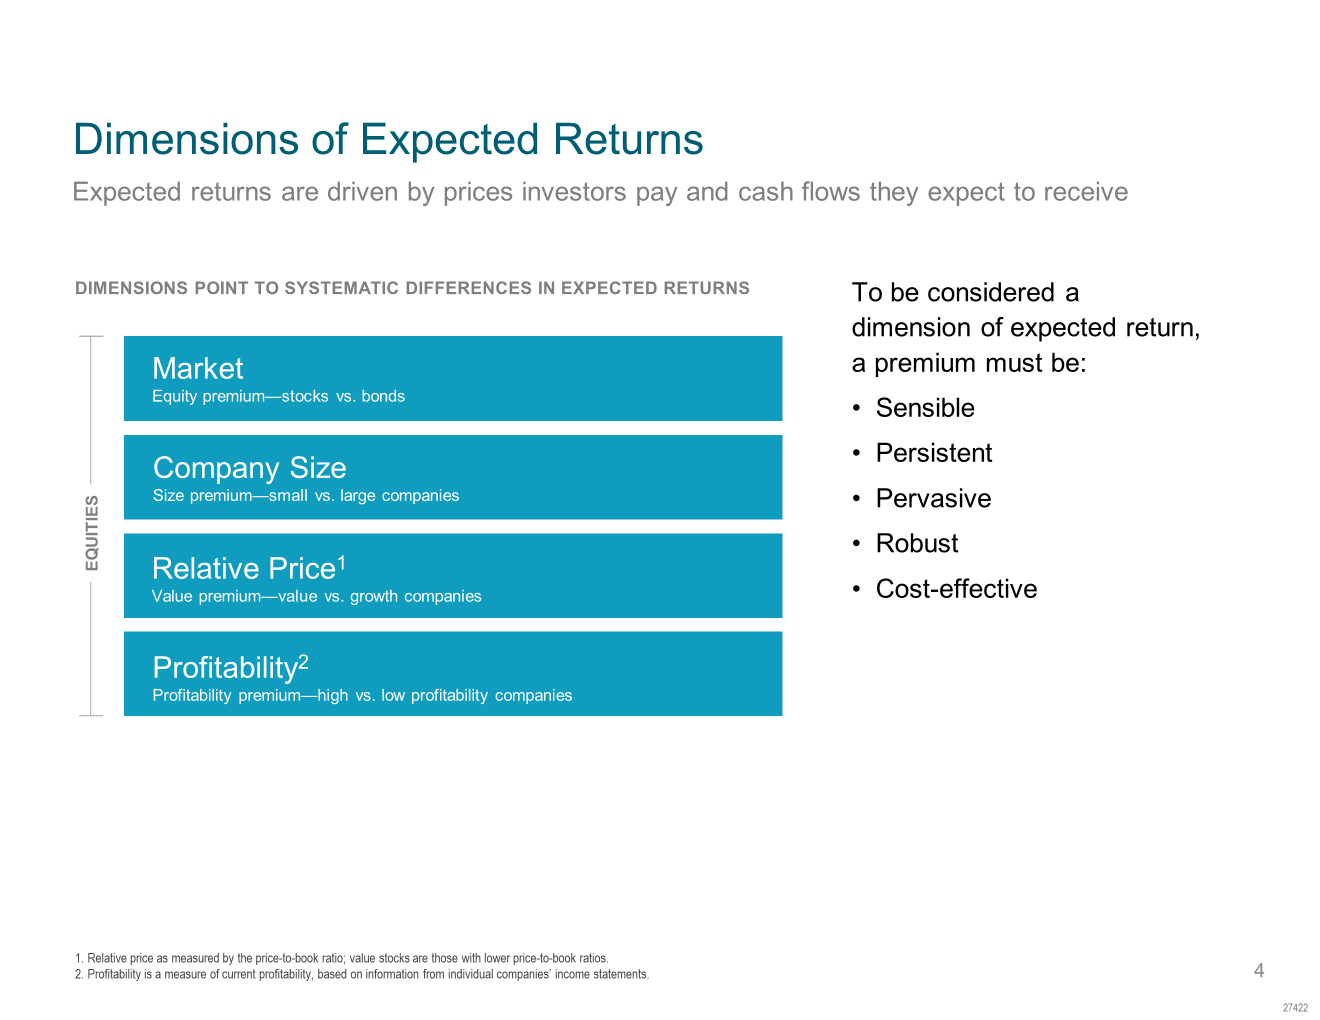
Here’s something we think about a lot when advising clients: What’s the difference between investing and speculating? When we invest in stocks, we’re buying a piece of a company that creates products, generates revenue and hopefully profits, and often pays dividends. When we buy bonds, we’re lending money in exchange for interest payments. These investments produce actual income and have measurable value. This is known in investment theory as having an expected return, which is a fundamental concept of investing that predicts the average return an investor might receive over time, based upon the asset’s risk and historical performance. Because the future is very uncertain, actual returns deviate from expected returns, but we don’t get to make decisions in hindsight. We have to make the best decisions for the future based upon the situation as it is today, or as they say in economics “ex ante,” or before things happen.
Bitcoin is different from stocks or bonds. It does not generate income like stocks or bonds do. Its value comes solely from what other people are willing to pay for it – kind of like digital gold, but without thousands of years of human history behind it. This makes Bitcoin a speculative asset rather than a traditional investment. Its value depends on what buyers are willing to pay—a sentiment-driven mechanism. Consequently, its expected return is unknown, making it challenging to fit Bitcoin into traditional portfolio modeling frameworks. As our friends at Dimensional have written:
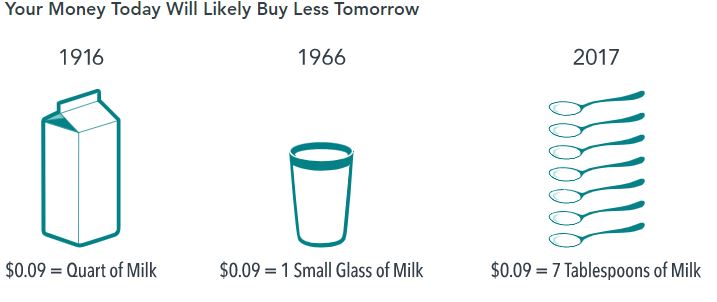
“Holding cash does not provide an expected stream of future cash flow. One US dollar in your wallet today does not entitle you to more dollars in the future. The same logic applies to holding other fiat currencies — and holding bitcoins in a digital wallet. So we should not expect a positive return from holding cash in one or more currencies unless we can predict when one currency will appreciate or depreciate relative to others.
The academic literature overwhelmingly suggests that short-term currency movements are unpredictable, implying there is no reliable and systematic way to earn a positive return just by holding cash, regardless of its currency. So why should investors hold cash in one or more currencies? One reason is because it provides a store of value that can be used to manage near-term known expenditures in those currencies.
With this framework in mind, it might be argued that holding bitcoins is like holding cash; it can be used to pay for some goods and services. However, most goods and services are not priced in bitcoins.
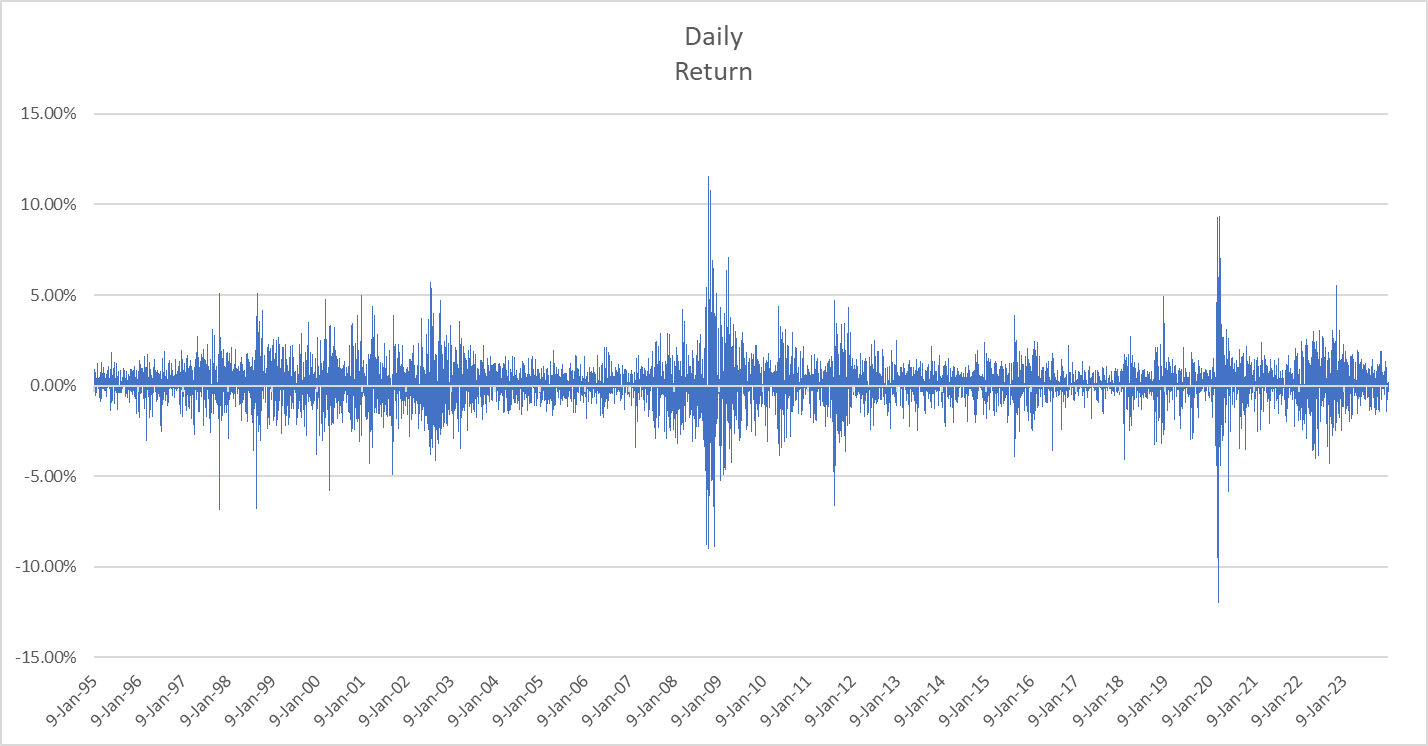
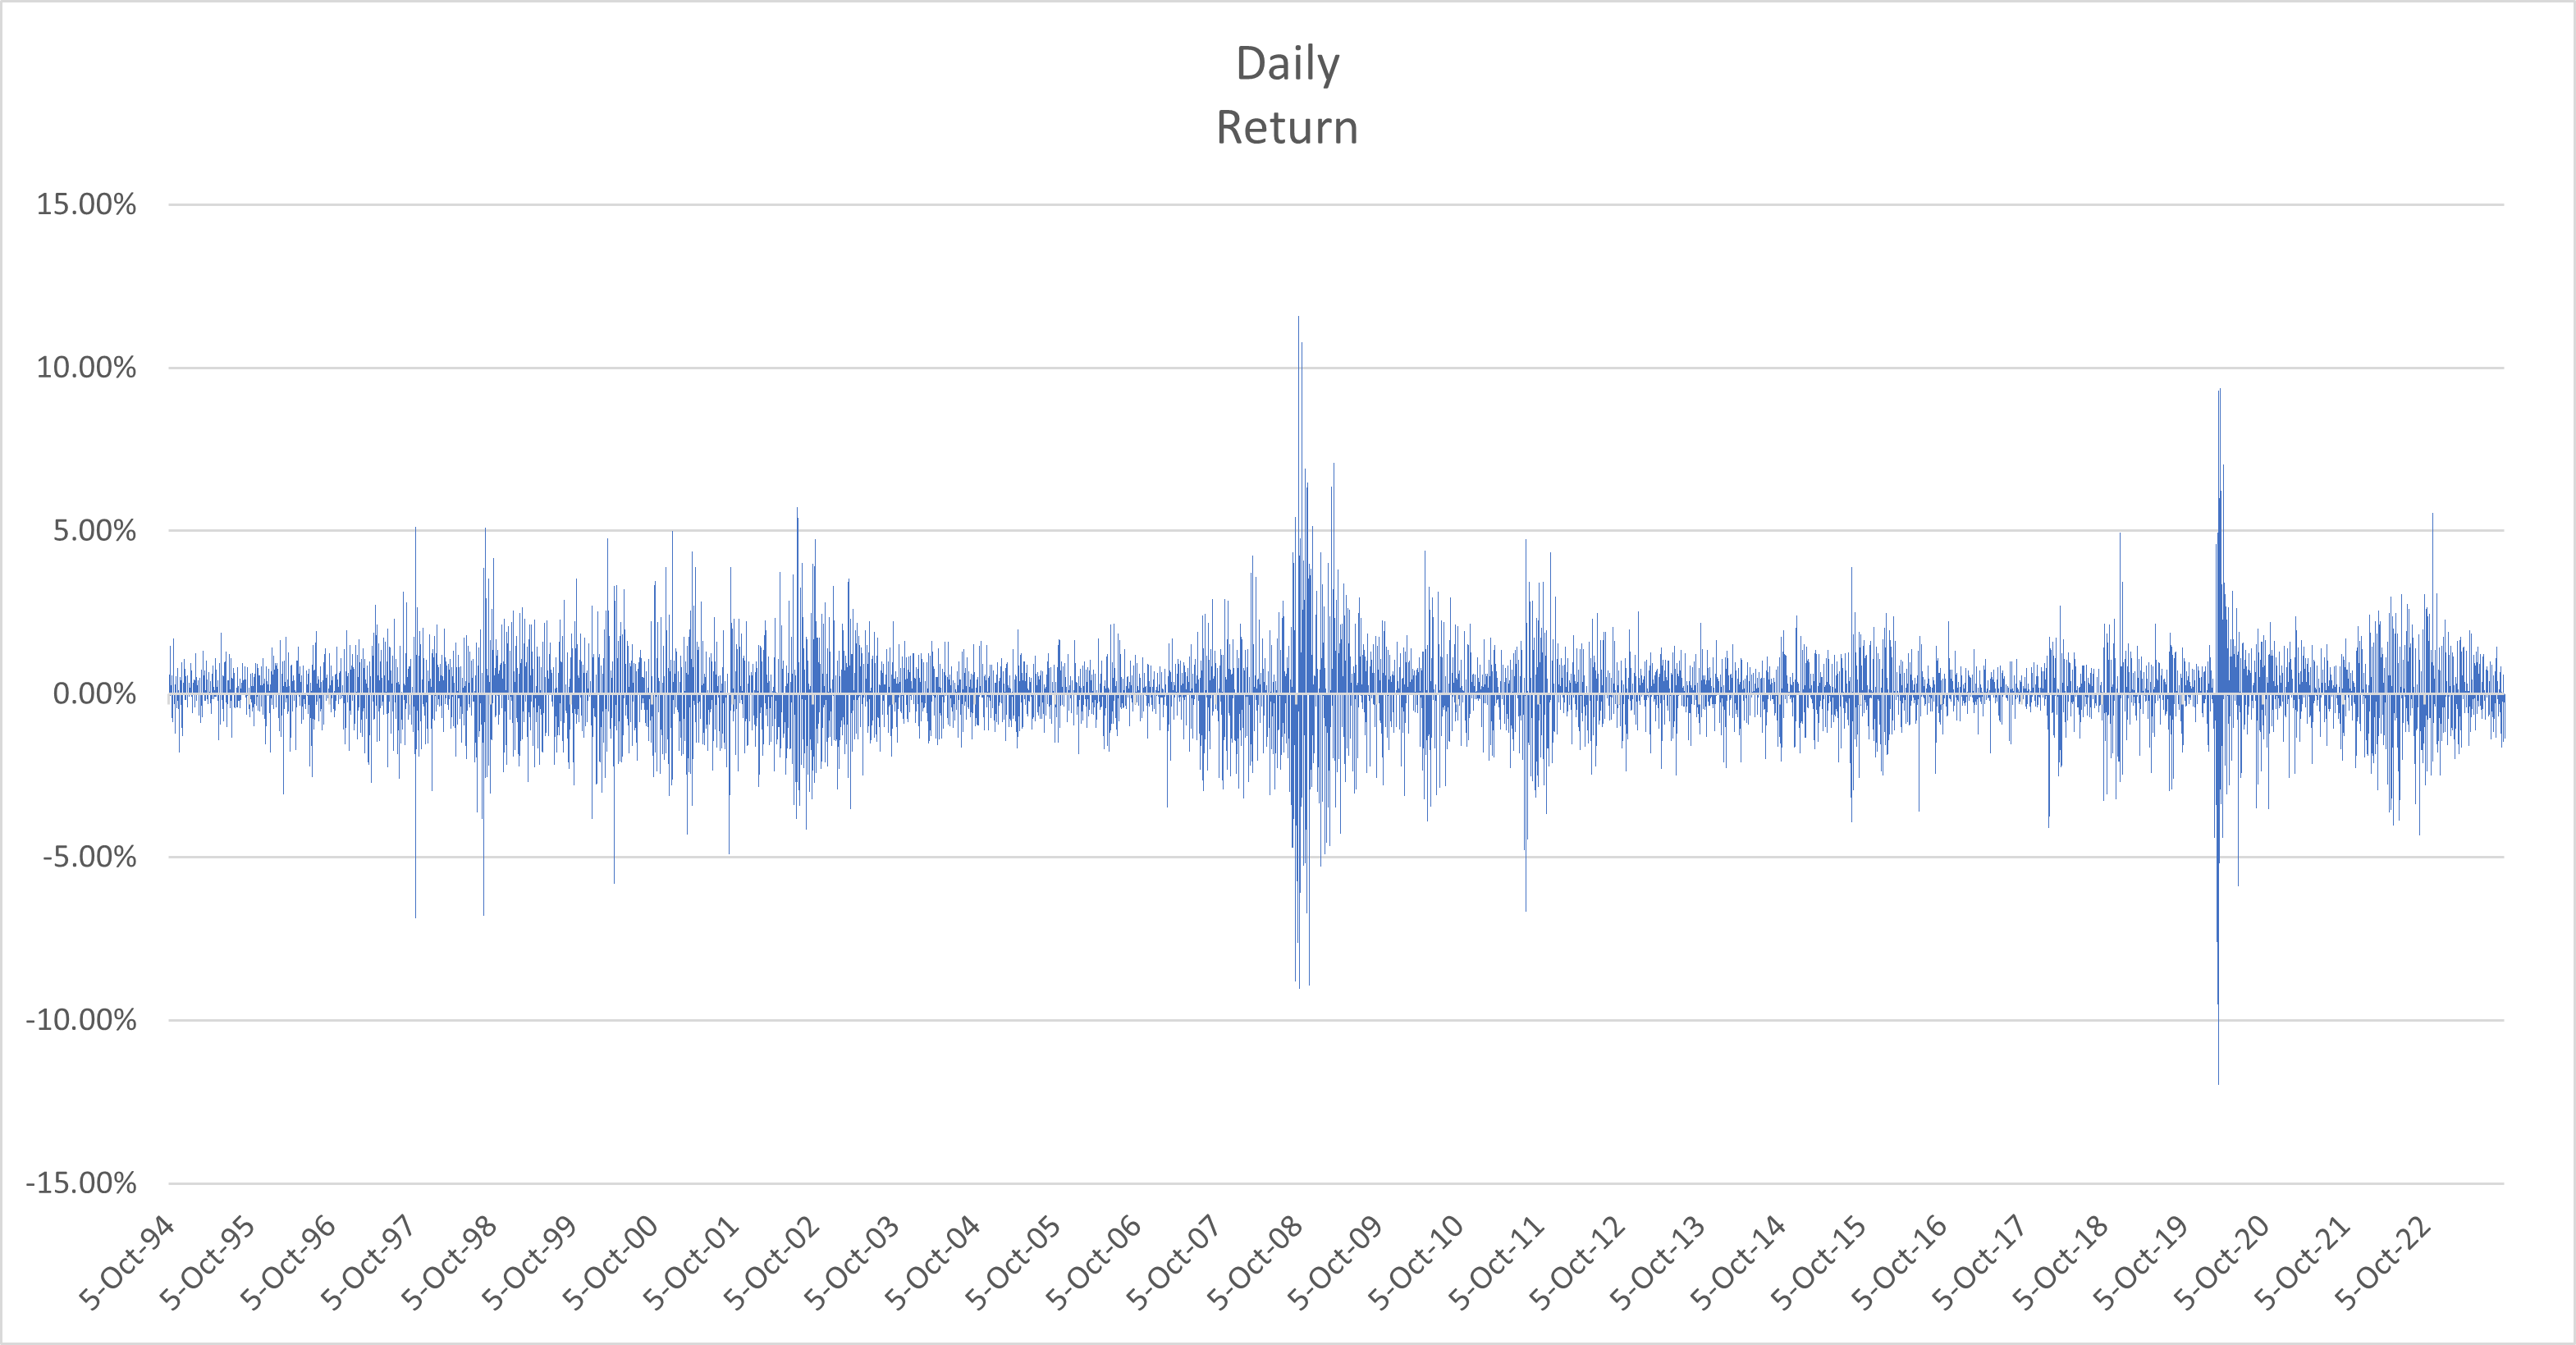
A lot of volatility has occurred in the exchange rates between bitcoins and traditional currencies. That volatility implies uncertainty, even in the near term, in the amount of future goods and services your bitcoins can purchase. This uncertainty, combined with possibly high transaction costs to convert bitcoins into usable currency, suggests that the cryptocurrency currently falls short as a store of value to manage near-term known expenses. Of course, that may change in the future if it becomes common practice to pay for all goods and services using bitcoins.”
While Bitcoin’s technological innovation is significant and its potential for reducing financial friction is intriguing, there are important considerations to weigh. The high energy consumption of Bitcoin mining raises concerns, and its price volatility makes it challenging to function as a reliable store of value or medium of exchange in practice. While bitcoin has demonstrated staying power over the years, it’s worth noting that many of its purported benefits, like financial inclusion and efficient cross-border payments, could potentially be achieved through other means, such as improved traditional financial infrastructure.
Why This Matters for Your Portfolio
When we build your portfolio, we focus on investments where we can reasonably expect long-term returns based on historical data and economic fundamentals. This helps us plan for your retirement, your children’s education, or whatever financial goals you’ve shared with us.
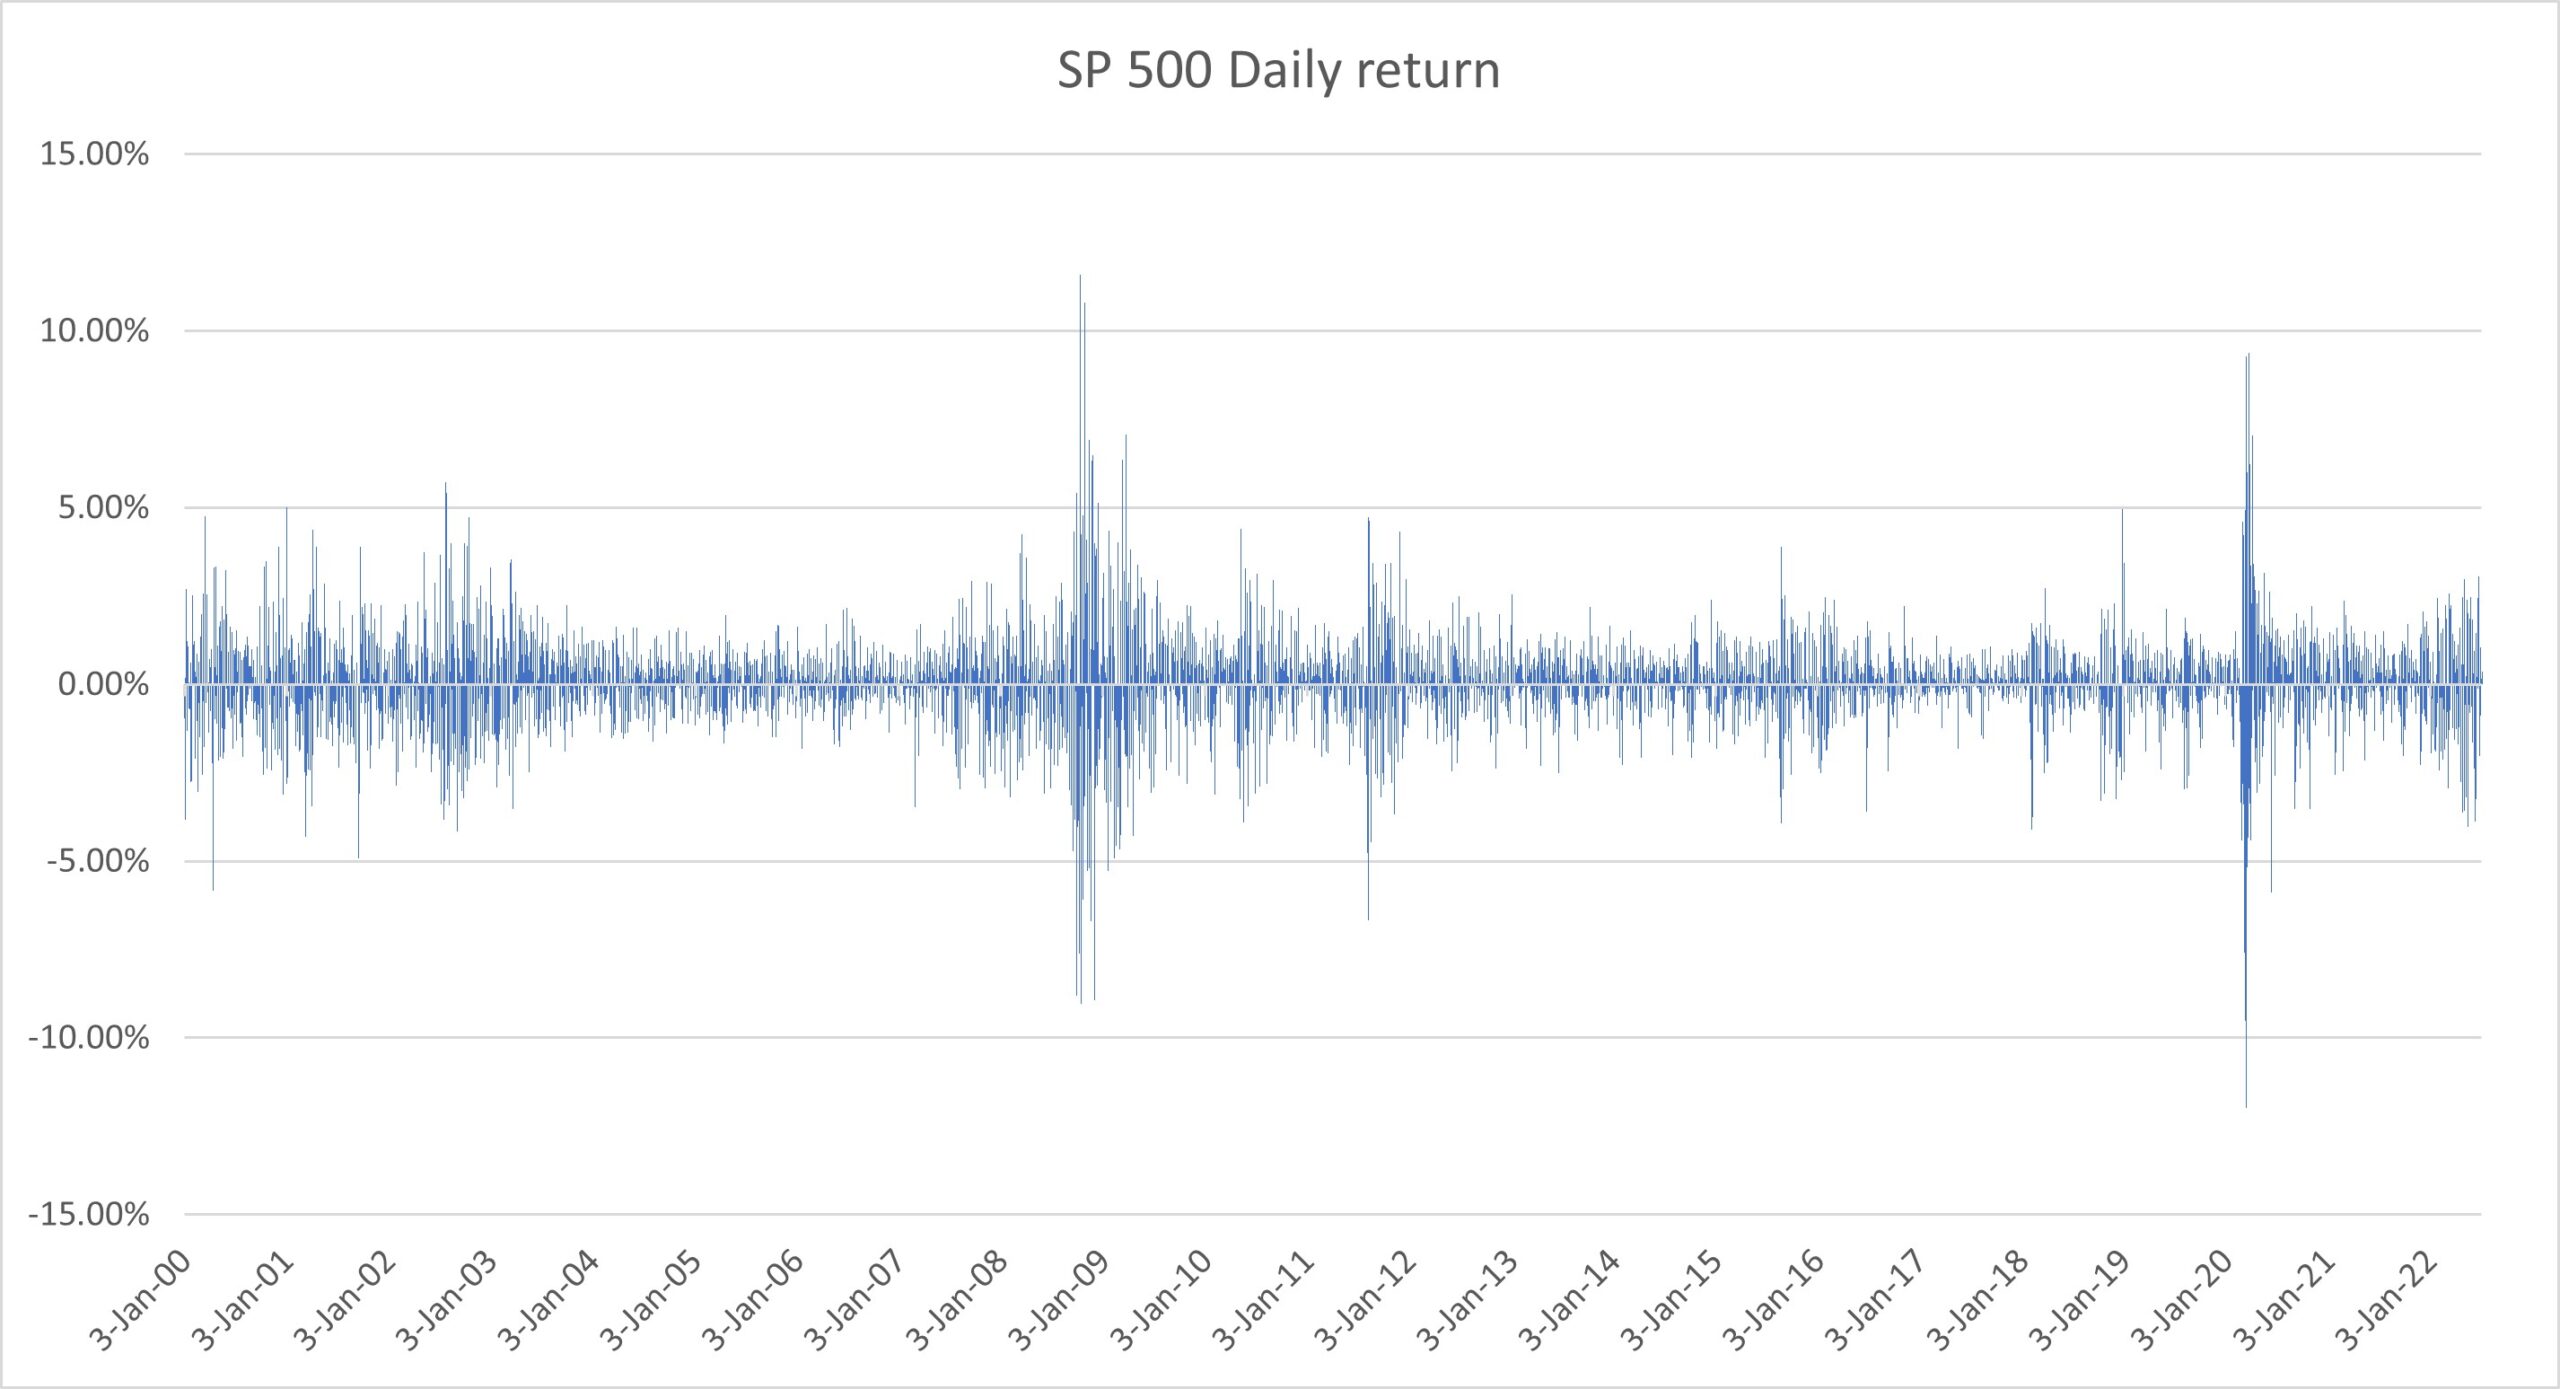
Bitcoin’s price swings can be extreme – much more volatile than stocks or bonds. While some investors have made significant profits, others have faced substantial losses. Unlike traditional investments, there’s no reliable way to estimate what Bitcoin might be worth in the future.
A Word About Bitcoin
Buying Bitcoin directly can be daunting – dealing with digital wallets, private keys, and cryptocurrency exchanges isn’t for everyone. In fact, an estimated 20% of all Bitcoin (worth over $140 billion) is lost forever because people forgot passwords or lost their storage devices. One cannot buy bitcoin directly from our custodian Charles Schwab & Co., Inc., as well as other major custodians.
There’s an interesting story about a man in Britain who offered his local government $70 million to dig up a landfill where he believed he’d thrown away a hard drive containing 7,500 Bitcoins.
Stories like this highlight why many investors prefer Bitcoin ETFs (Exchange-Traded Funds), which let you gain exposure to Bitcoin through your regular brokerage account. However, some of the advantages of bitcoin, such as privacy and anonymity, are lost by purchasing it in this form.
Our Take on Bitcoin in Your Portfolio
We believe Bitcoin is speculation rather than investment at this point and does not have a place in a portfolio seeking “expected” return. If you decide to invest in bitcoin or another cryptocurrency, it’s crucial to understand what you’re getting into. If you’re interested in Bitcoin exposure, we should discuss:
- How much risk you’re comfortable taking
- Why you want to invest in it
- In what form are you thinking about holding it?
Differentiating the Blockchain from Bitcoin
The blockchain is a technology that bitcoin and other cryptocurrencies utilize for their unique structure. A blockchain is a decentralized digital ledger that records transactions across a network of computers. Unlike traditional databases managed by a central authority, blockchain technology creates an immutable chain of data blocks, where each block contains transaction information and is cryptographically linked to the previous block. This structure makes it extremely difficult to alter historical records without detection, providing transparency and security for various applications beyond just cryptocurrencies.
By having a diversified portfolio, an investor most assuredly has some exposure to the blockchain. Many public companies have indeed invested in blockchain technology. For example, Microsoft has integrated blockchain solutions into its Azure cloud platform, while IBM has developed its own blockchain platform for enterprise use. Companies like Visa and Mastercard have invested heavily in blockchain payment solutions, and even traditional retailers like Walmart use blockchain for supply chain management. Investment firms like BlackRock and Fidelity have also developed blockchain-related products and services. Among technology companies in the Russell 3000, Oracle has implemented blockchain solutions for supply chain tracking, while Block (formerly Square) has made significant investments in blockchain and cryptocurrency infrastructure.
What’s Next?
If you’re curious about bitcoin or any other cryptocurrency, please reach out. We are here to help you understand your options and make informed decisions that align with your financial goals. We will continue to monitor the situation, and if volatility normalizes or bitcoin becomes a more reliable store of value or medium of exchange, we will consider those facts.
Remember, our job is to help you understand the risks and as well as the rewards of an “investment” versus a “speculation” so you can make choices that work for your unique situation.
Til next time,
Mike and Emily
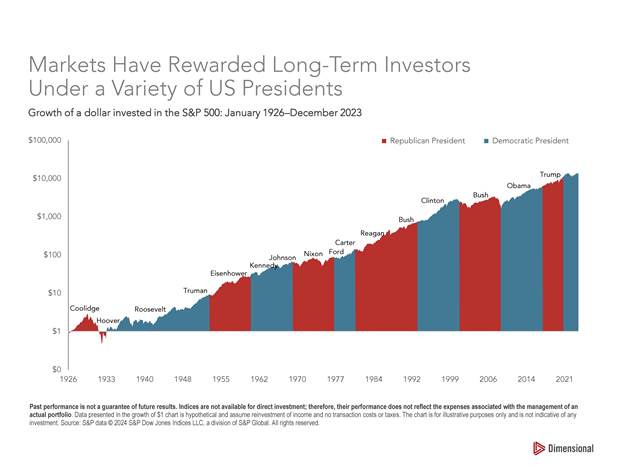
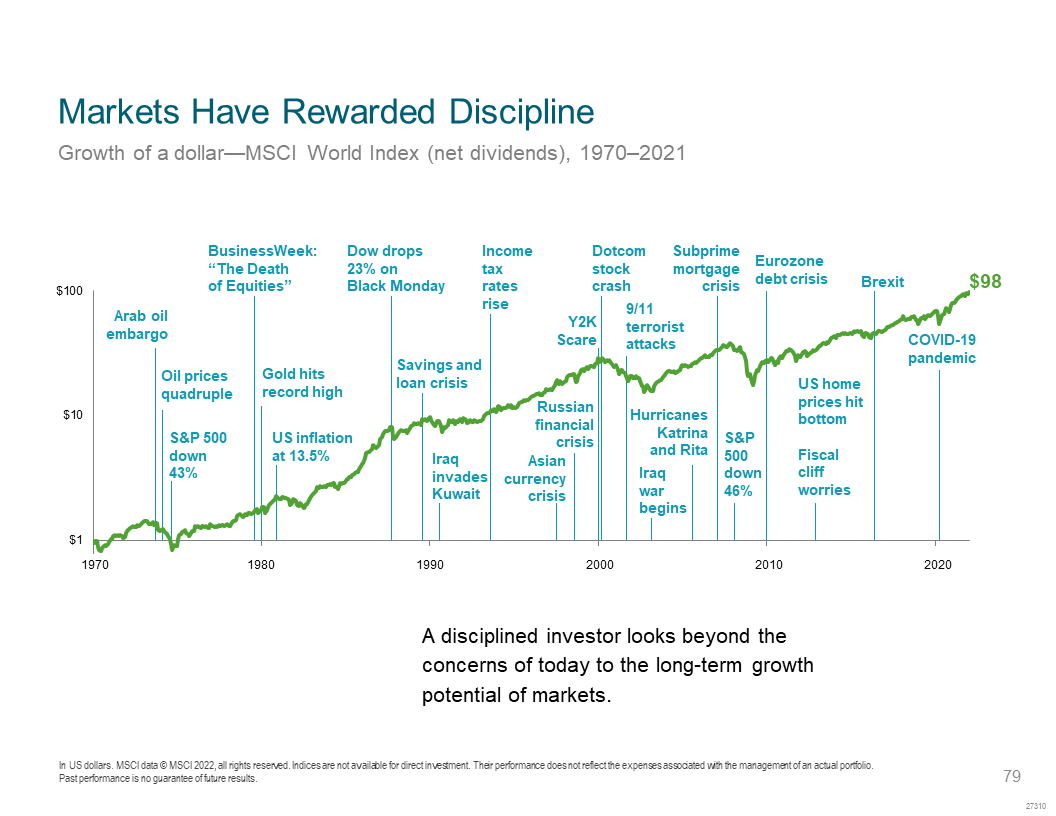


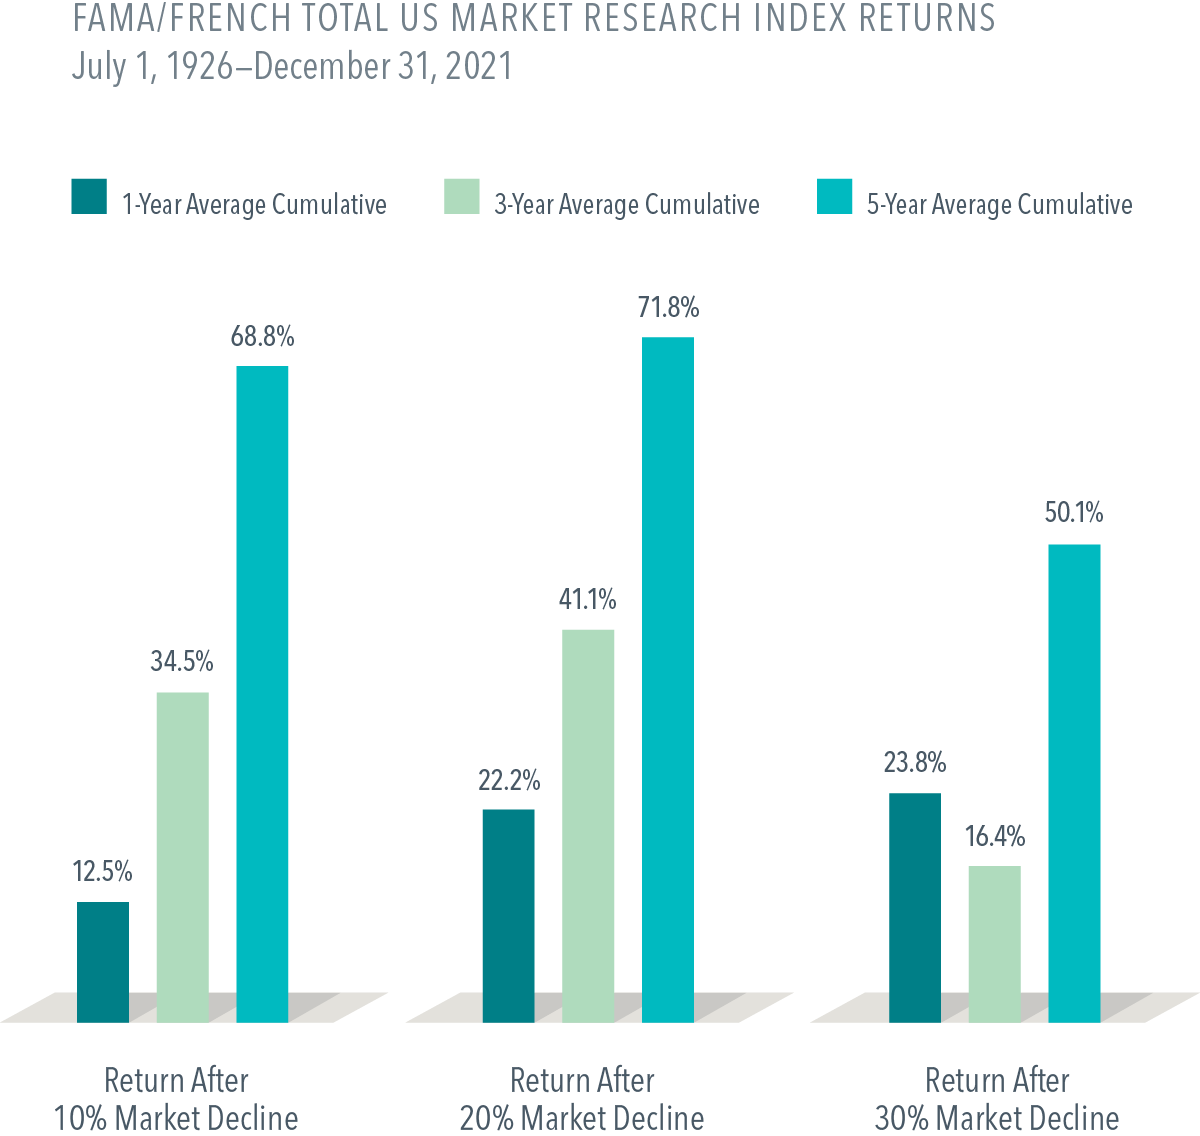


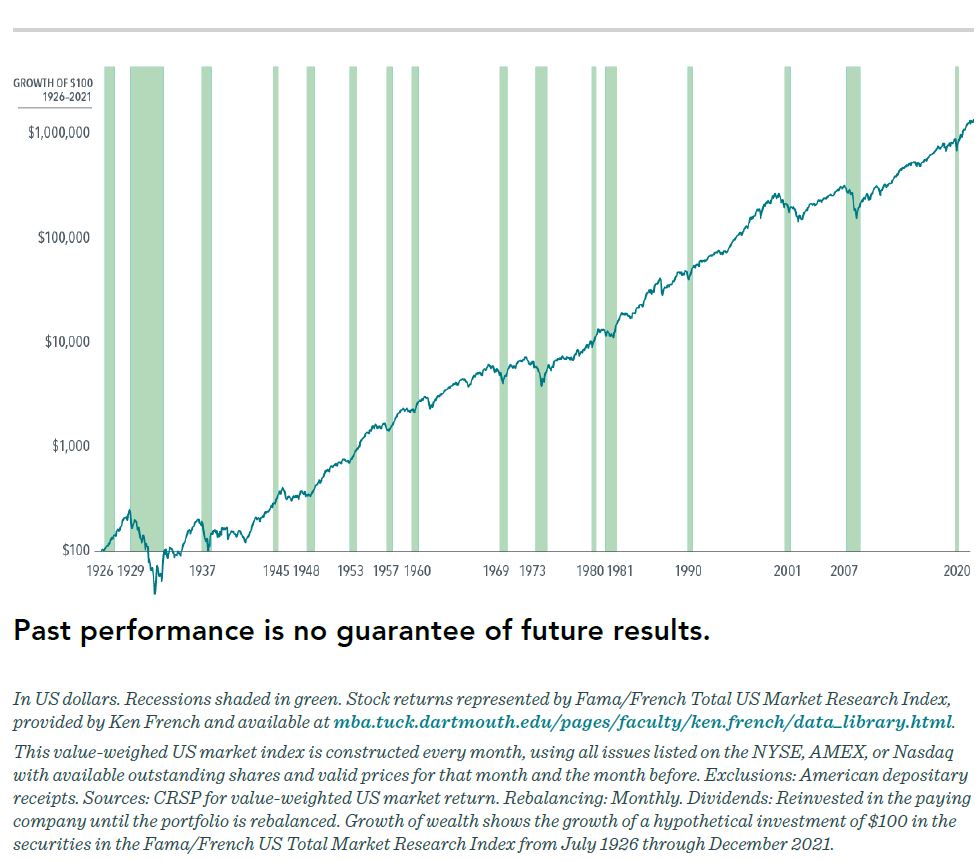

 Whether accompanied by recessions or not, market downturns can be unsettling. But over the past century, US stocks have averaged positive returns over one-year, three-year, and five-year periods following a steep decline.
