
“We find no evidence that inverted yield curves predict stocks will underperform Treasury bills for forecast periods of one, two, three, and five years.”
Eugene Fama and Ken French
“The Death of Equities: How Inflation Is Destroying the Stock Market.”
Headline – Business Week – August 13, 1979
“The biggest risk facing investors is not short-term volatility but, rather, the risk of not earning a sufficient return on their capital as it accumulates.”
John Bogle
Quarterly Summary
Below are the indices we follow.
| Periodic Performance | ||||||
| By 09/2019; Default Currency: USD | ||||||
| 3 Months | YTD | 1 Year | 3 Years | 5 Years | 10 Years | |
| S&P 500 | 1.70 | 20.55 | 4.25 | 13.39 | 10.84 | 13.24 |
| Russell 2000 | -2.40 | 14.18 | -8.89 | 8.23 | 8.19 | 11.19 |
| Russell 2000 Value | -0.57 | 12.82 | -8.24 | 6.54 | 7.17 | 10.06 |
| MSCI World ex USA (net div) | -0.93 | 13.57 | -0.95 | 6.49 | 3.06 | 4.78 |
| MSCI World ex USA Small (net div) | -0.27 | 12.58 | -5.62 | 5.54 | 5.14 | 6.93 |
| MSCI Emerging (net div) | -4.25 | 5.89 | -2.02 | 5.97 | 2.33 | 3.37 |
| Bloomberg Barclays U.S. T Bond 1-5 Yr | 0.76 | 3.90 | 5.72 | 1.62 | 1.69 | 1.69 |
| ICE BofAML 1-Year US T Note | 0.56 | 2.33 | 3.13 | 1.60 | 1.12 | 0.79 |
As you can see, the quarter was mixed. US equities outperformed non-US developed and emerging markets during the third quarter. Value stocks outperformed growth stocks in the US but underperformed in non-US and emerging markets. Small caps outperformed large caps in non-US markets but underperformed in the US and emerging markets.
YIELD CURVES, RECESSIONS AND INVESTING
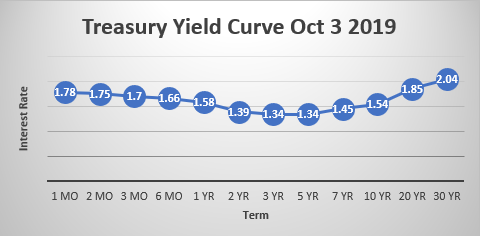
There is a lot of noise surrounding inverted yield curves. The topic has even made the headlines of the nightly news. The 3 month treasury bill rate has been greater than the 10 year bond rate recently. Normally, longer dated maturities will have a higher rate. Inverted yield curves are a predictor of recessions, and the inversion occurs on average about 14 months before the onset of recession. See the yield curve as of Thursday, October 3, 2019.
The better question for investors is should they change their asset allocation as a result of an inverted yield curve. The answer is NO. Nobel Prize winner Gene Fama and Ken French just published a paper on the topic, and they concluded:
“We find no evidence that inverted yield curves predict stocks will underperform Treasury bills for forecast periods of one, two, three, and five years.”
Below is a good link to an article in Fortune with a bit more detail. https://fortune.com/2019/08/13/recession-benchmark-timing-stock-market/
Here is a link to their academic paper. https://famafrench.dimensional.com/media/467645/inverted-yield-curves-and-expected-stock-returns-july-28-2019.pdf
It is important to take a long-term view, and don’t take your investment advice from the nightly news anchor! As you can see by the second quote above at the top of this newsletter, the mass media really does not have a good record predicting long-term returns.
TIMING ISN’T EVERYTHING (A piece from Dimensional Fund Advisors)
A neighbor or relative might ask about which investments are good at the moment. The lure of getting in at the right time or avoiding the next downturn may tempt even disciplined, long-term investors. The reality of successfully timing markets, however, isn’t as straightforward as it sounds.
OUTGUESSING THE MARKET IS DIFFICULT
Attempting to buy individual stocks or make tactical asset allocation changes at exactly the “right” time presents investors with substantial challenges. First and foremost, markets are fiercely competitive and adept at processing information. During 2018, a daily average of $462.8 billion in equity trading took place around the world.[1] The combined effect of all this buying and selling is that available information, from economic data to investor preferences and so on, is quickly incorporated into market prices. Trying to time the market based on an article from this morning’s newspaper or a segment from financial television? It’s likely that information is already reflected in prices by the time an investor can react to it.
Dimensional recently studied the performance of actively managed mutual funds and found that even professional investors have difficulty beating the market: over the last 20 years, 77% of equity funds and 92% of fixed income funds failed to survive and outperform their benchmarks after costs.[2]
Further complicating matters, for investors to have a shot at successfully timing the market, they must make the call to buy or sell stocks correctly not just once, but twice. Professor Robert Merton, a Nobel laureate, said it well in a recent interview with Dimensional:
“Timing markets is the dream of everybody. Suppose I could verify that I’m a .700 hitter in calling market turns. That’s pretty good; you’d hire me right away. But to be a good market timer, you’ve got to do it twice. What if the chances of me getting it right were independent each time? They’re not. But if they were, that’s 0.7 times 0.7. That’s less than 50-50. So, market timing is horribly difficult to do.”
TIME AND THE MARKET
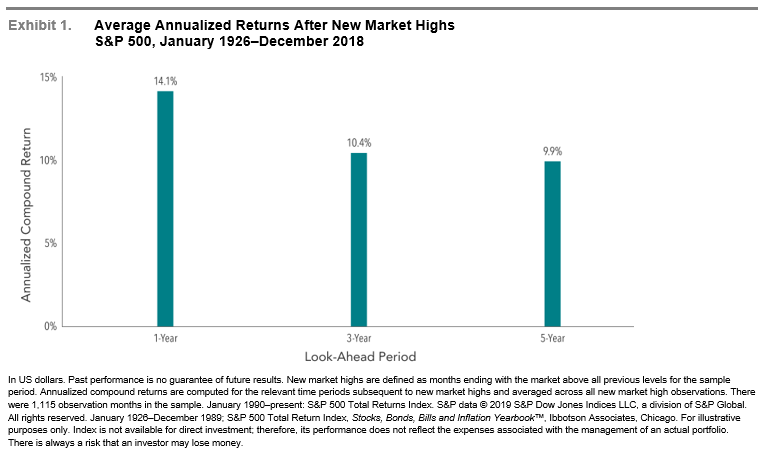
The S&P 500 Index has logged an incredible decade. Should this result impact investors’ allocations to equities? Exhibit 1 suggests that new market highs have not been a harbinger of negative returns to come. The S&P 500 went on to provide positive average annualized returns over one, three, and five years following new market highs.
CONCLUSION
Outguessing markets is more difficult than many investors might think. While favorable timing is theoretically possible, there isn’t much evidence that it can be done reliably, even by professional investors. The positive news is that investors don’t need to be able to time markets to have a good investment experience. Over time, capital markets have rewarded investors who have taken a long-term perspective and remained disciplined in the face of short-term noise. By focusing on the things they can control (like having an appropriate asset allocation, diversification, and managing expenses, turnover, and taxes) investors can better position themselves to make the most of what capital markets have to offer.
All the best,
Mike and Emily
P.S.Here is a good short video from Nobel Prize Winner in Economics Gene Fama on reacting to markets. Less than 2 minutes. Enjoy. https://videos.dimensional.com/share/v/1_1tsep52t
[1]. In US dollars. Source: Dimensional, using data from Bloomberg LP. Includes primary and secondary exchange trading volume globally for equities. ETFs and funds are excluded. Daily averages were computed by calculating the trading volume of each stock daily as the closing price multiplied by shares traded that day. All such trading volume is summed up and divided by 252 as an approximate number of annual trading days.
[2]. Mutual Fund Landscape 2019.