“In today’s rapidly changing economy, even the strongest and best-managed companies face the risk of a decline in competitive position and stock underperformance over time,” said Thomas E. Faust Jr., chief investment officer of Eaton Vance Management, regarding the collapse of Enron. His advice was old- fashioned: “Don’t put all of your eggs in one basket.”
The Atlanta Journal – Constitution; Atlanta, Ga.. 08 Feb 2002
“Economist Joseph Schumpeter argues in “Capitalism, Socialism, and Democracy” that capitalism is never stationary and always evolving, with new markets and new products entering the sphere. He is perhaps most known for coining the phrase “creative destruction,” which describes the process that sees new innovations (and companies) replacing existing ones that are rendered obsolete over time.”
Schumpeter’s Theory of Creative Destruction, Carnegie Mellon, 2019
“Part of the never-ending story of competitiveness is creative destruction: many new businesses end up displacing incumbents who were at one time leaders themselves. We monitor this creative destruction in a number of ways. As shown in the first chart below, there is a constant drumbeat of companies removed from the S&P 500 due to business distress. Furthermore, more than 40% of all companies that were ever in the Russell 3000 Index experienced a “catastrophic stock price loss”, which we define as a 70% decline in price from peak levels which is not recovered.”
“The Agony & the Ecstasy: The Risks and Rewards of a Concentrated Stock Position JP Morgan, 2022.”
The US equity market posted positive returns for the quarter and outperformed non-US developed markets, but underperformed emerging markets. Value underperformed growth, and small cap stocks underperformed large caps for the quarter. Below are some of the indices we follow.
| Data Series | 3 Months | YTD | 1 Year | 3 Years | 5 Years | 10 Years |
| Russell 3000 | 3.22% | 13.56% | 23.13% | 8.05% | 14.14% | 12.15% |
| S&P 500 | 4.28% | 15.29% | 24.56% | 10.01% | 15.05% | 12.86% |
| Russell 2000 | -3.28% | 1.73% | 10.06% | -2.58% | 6.94% | 7.00% |
| Russell 2000 Value | -3.64% | -0.85% | 10.90% | -0.53% | 7.07% | 6.23% |
| MSCI World ex USA | -0.60% | 4.96% | 11.22% | 2.82% | 6.55% | 4.27% |
| MSCI World ex USA Small Cap | -1.56% | 0.98% | 7.80% | -2.98% | 4.69% | 4.04% |
| MSCI Emerging Mkts | 5.00% | 7.49% | 12.55% | -5.07% | 3.10% | 2.79% |
| Bloomberg U.S. T Bond 1-5 Years | 0.77% | 0.71% | 4.12% | -0.45% | 0.71% | 1.12% |
| ICE BofA 1-Year US T Note | 1.11% | 1.95% | 5.02% | 1.80% | 1.69% | 1.36% |
Magnificent 7 Stocks
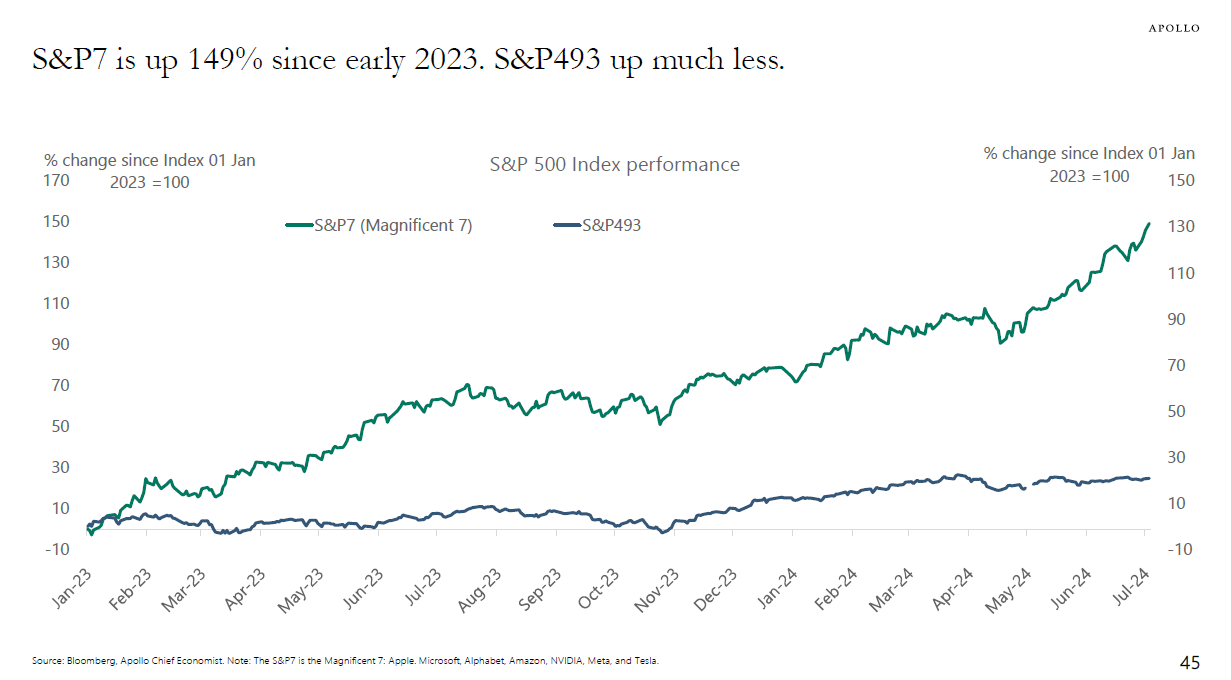
We have been getting questions on Nvidia and the “Magnificent Seven” for a bit now. While Nvidia and the “Magnificent Seven” (Apple, Microsoft, Alphabet, Amazon, Meta Platforms, and Tesla) have been market leaders, concentrating your entire portfolio on them carries significant risks. Investment theory emphasizes diversification as a core principle and argues that by spreading investments across uncorrelated assets, you can reduce overall portfolio risk without sacrificing returns. Even within the “Magnificent Seven,” a downturn in one sector, like technology, could disproportionately impact your holdings. Below is a graph from Apollo showing how the Mag 7 has performed since January of 2023 compared to the other 493 stocks in the S&P 500.

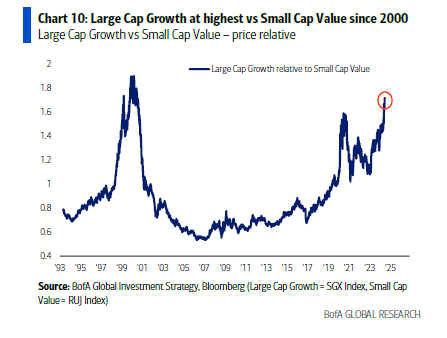
Nvidia and the other companies in the Mag 7, despite the impressive performance, are subject to company specific risks such as competition and regulatory changes. Over-reliance on these stocks could lead to significant losses if they underperform. As Bank of America showed this week, large cap growth relative to small cap value is at its highest valuation since the tech bubble in 2000.

We are not saying that we can time these things. However, tilting to factors such as value, profitability and small cap further supports diversification. Financial research suggests that market returns are driven by factors beyond just the overall market movement. These factors include size (small vs. large companies), value (cheap vs. expensive stocks), profitability, and investment (companies that invest heavily vs. those that don’t). Diversifying across these factors gives the potential of long term gains without exposing yourself to concentration risk.
History provides stark reminders of the dangers of concentrated portfolios. The tech crash of 2000 serves as a prime example. Back then, Cisco was a darling of the tech world, its stock price soaring to an all-time high of over $80 per share in March 2000. Investors piled into the company, believing its dominance in networking equipment was unassailable.
The tech bubble burst in early 2000 as investor sentiment shifted. Companies with inflated valuations, like Cisco, were particularly vulnerable. Cisco’s stock price plummeted, losing a staggering 89% of its value and reaching a low of $8.60 in October 2002. Here is what the well-known financial publication Barron’s had to say in its February 14, 2000, edition, weeks before the correction started.
“Fans of Cisco were trumpeting its potential to become the first $1 trillion company in market value following its blow-out profit report on Tuesday.
Cisco rose 9 13/16 to 131 last week after hitting a record high of 136 1/4, giving the company a market value of $475 billion. Cisco last week became No. 2 in market capitalization after overtaking General Electric, which has a value of $440 billion. Microsoft has the largest market cap at $554 billion.
Cisco, which is up more than 400-fold from a split-adjusted price of 31 cents a share at its initial public offering exactly a decade ago, now has to roughly double again to hit the magic $1 trillion mark. Considering that Cisco rose 131% last year after gaining 150% in 1998, another double doesn’t seem like such a stretch.
Cisco now is deemed a better bet than Microsoft to hit $1 trillion first because its profit momentum is stronger. Cisco had pro-forma profits of 25 cents in the quarter ended January 31, up 47% from 17 cents a year earlier, on a 53% rise in revenues. Microsoft’s profits per share were up a sizable 31% in the fourth quarter.”
Sounds familiar, huh? Cisco’s dramatic decline highlights the perils of overconfidence in any single stock, no matter how strong the company appears. We do not know where things are going. However, we do know single stock risk is real.
While Cisco survived the crash and remains a major player in the networking industry, its stock price has never fully recovered. As of July 2024, it trades at around $47 per share, well below its 2000 peak 24 years ago. This is a significant reminder that even seemingly invincible companies can experience long-term declines.
BlackBerry, a pioneer in mobile phones, couldn’t adapt to the rise of Apple and Android smartphones and its stock price plummeted by over 80% in 2011. Lehman Brothers, a major investment bank, collapsed during the 2008 financial crisis. AIG, another financial giant who was only one of a handful of companies with the highest AAA credit rating, required a government bailout after suffering massive losses. Anheuser-Busch reached a peak of over $130 per share in September of 2016, while trading today just below $60 per share, 8 years later. These cautionary tales are but a few that exist highlighting the dangers of concentrating your portfolio in a few seemingly invincible companies.
Diversification allows you to benefit from growth in different sectors and asset classes. By spreading your investments among different asset classes and geographies, you create a more resilient portfolio less susceptible to the fortunes of any single company or sector.
It’s important to remember that even the “Magnificent Seven” may not maintain their dominance forever. New technologies and business models can disrupt established industries, as shown by the plight of Blackberry above. Diversification allows you to participate in future growth opportunities beyond the current market leaders, thereby benefiting from creative destruction and capitalism.
Meir Statman, a renowned finance professor from Santa Clara University, wrote a nice piece for Avantis Investors, one of the fund companies we use. Diversification vs. Concentration in the Era of the ‘Magnificent Seven’ Here are some useful thoughts. The entire piece is worth reading.
Students “note their surprise at the large role of luck in the outcomes of their portfolios. Some stocks they thought would do well performed poorly, and some they thought would do poorly performed well. Some stocks chosen after careful analysis did well, but others performed poorly, and some chosen at random did well, but others performed poorly…”
“Much of the benefit of diversification comes from the fact that the overall positive returns of stocks come from a few winners. Indeed, the returns of most stocks lag those of the U.S. Treasury bill. Moreover, the identities of the winning stocks vary over time, with technology stocks in 2023 and energy stocks in 2022.
A portfolio diversified among all stocks, technology, energy, and all other industries would likely include the winning stocks, even if their identities were unknown in foresight. A concentrated portfolio would likely miss them.
A portfolio concentrated in technology in 2023 and energy in 2022 would have made investors winners, but a portfolio concentrated in energy in 2023 and technology in 2022 would have made them losers.
Wise investors holding diversified portfolios are likely to do well over the long run, even if not over the short run. However, investors holding concentrated portfolios are likely to do poorly over the long run, even if they do well over many short runs.”
Below are returns for the Nasdaq and S&P 500 for the decade starting January 2000 and ending December 2009. As you can see, if you had all of your money in Nasdaq, your $1,000,000 turned into approximately $557,600 at the end of the decade. Being diversified in large value, small, small value and international helped portfolios tremendously during that decade.
| Data Series | Annualized Return | Total Return | Growth of Wealth |
| NASDAQ Composite Price Return | -5.67% | -44.24% | 55.76% |
| S&P 500 | -0.95% | -9.10% | 90.90% |
| Russell 3000 Value | 2.87% | 32.75% | 132.75% |
| Russell 2000 | 3.51% | 41.26% | 141.26% |
| Russell 2000 Value | 8.27% | 121.38% | 221.38% |
| MSCI EAFE (net div.) | 1.17% | 12.38% | 112.38% |
| MSCI Emerging Markets (net div.) | 9.78% | 154.28% | 254.28% |
While Nvidia and the “Magnificent Seven” are impressive companies, a diversified portfolio is essential for long-term investment success. As Peter Bernstein and Aswath Damodaran wrote in their book Investment Management,
“Staying rich requires an entirely different approach from getting rich. It might be said that one gets rich by working hard and taking big risks, and that one stays rich by limiting risk and not spending too much.”
Election 2024
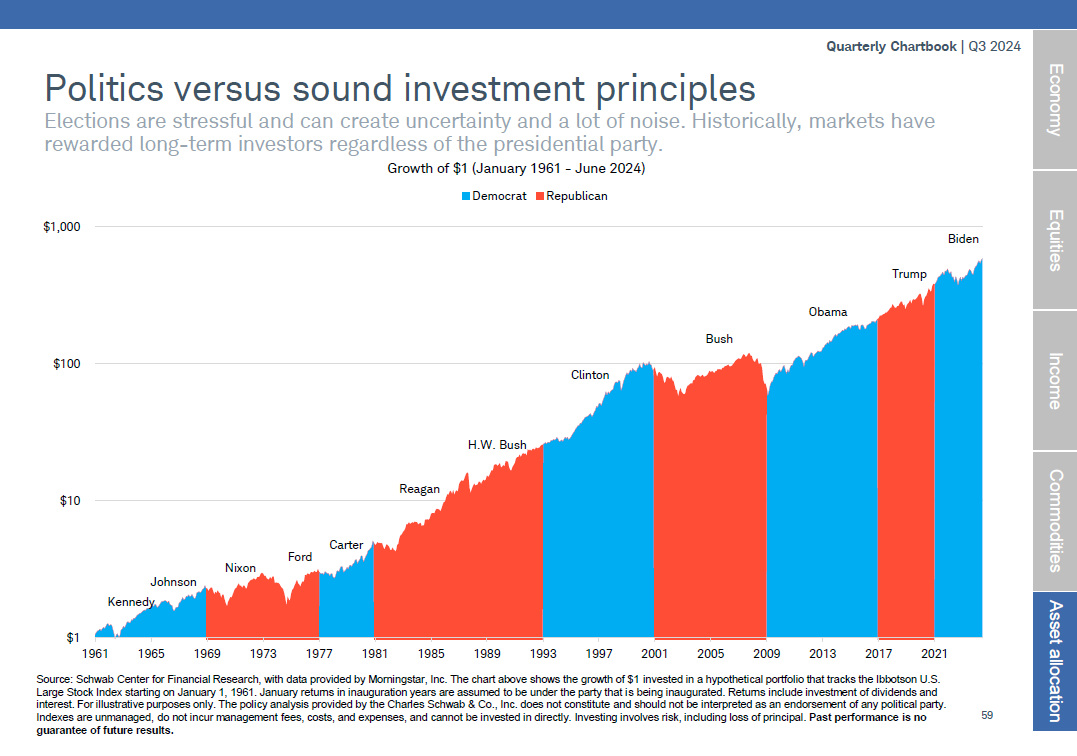
The election season is upon us. After last weekend, we know there will be increased scrutiny and coverage. We want to reiterate that although in the short-term there could be volatility in the market, we believe taking a long-term view should not impact our diversified approach. Below is some information to keep you rational in a time of uncertainty and emotion.
How Much Impact Does the President Have on Stocks?

Until next time,
Mike and Emily

