“Like solo sailors venturing into the Southern Ocean, climbers are seduced by risk. The desire to push to a summit or scale a rock face is so strong that they consciously or subconsciously minimize safety precautions drilled into their brains.”
Charles Duhigg
“It amazes me how people are often more willing to act based on little or no data than to use data that is a challenge to assemble.”
Robert Shiller
“Irrational exuberance is the psychological basis of a speculative bubble. I define a speculative bubble as a situation in which news of price increases spurs investor enthusiasm, which spreads by psychological contagion from person to person, in the process amplifying stories that might justify the price increases and bringing in a larger and larger class of investors, who, despite doubts about the real value of an investment, are drawn to it partly through envy of others’ successes and partly through a gambler’s excitement.”
Robert Shiller, Irrational Exuberance
“Large price changes tend to be followed by more large changes, positive or negative. Small changes tend to be followed by more small changes. Volatility clusters. A fund manager or investor who cannot tolerate the risk of a large loss might, when the financial storm signs are up, simply trim his sails and avoid bold bets.”
Benoit Mandelbrot, The Misbehavior or Markets
The second quarter was a very good one overall for the equity markets. Below are the indices we track.
| Data Series (% USD) | 3 Months | YTD | 1 Year | 3 Years | 5 Years | 10 Years |
| S&P 500 | 20.54% | -3.08% | 7.51% | 10.73% | 10.73% | 13.99% |
| Russell 2000 | 25.42% | –12.98% | -6.63% | 2.01% | 4.29% | 10.50% |
| Russell 2000 Value | 18.91% | -23.50% | -17.48% | -4.35% | 1.26% | 7.82% |
| MSCI World ex USA | 15.34% | -11.49% | -5.42% | 0.84% | 2.01% | 5.43% |
| MSCI World ex USA Small Cap | 21.66% | -12.87% | -3.20% | 0.53% | 3.56% | 7.26% |
| MSCI Emerging Markets | 18.08% | -9.78% | -3.39% | 1.90% | 2.86% | 3.27% |
| Bloomberg Barclays U.S. T Bond 1-5 Yr | 0.40% | 4.23% | 5.38% | 3.28% | 2.33% | 1.85% |
| ICE BofA 1-Year US T Note | -0.03% | 1.69% | 2.86% | 2.25% | 1.54% | 0.95% |
Obviously, it has been a very wild ride. The first quarter was one of the worst in the history of the US stock markets, and the second quarter was one of the best. Although the quarter was a good one, volatility remains elevated significantly from historical averages, and as long as the coronavirus continues to infect and hospitalize significant amounts of people, it is almost assured that volatility will remain high.
When volatility is high, it does not predict whether stocks will decrease or increase in value, only that the swings either way will be larger than they are normally. However, because of that risk, people in retirement or close to it may want to consider their asset allocation to make sure it is not too aggressive in the event the market has a wild swing to the downside. If such an event would occur, markets may not recover fast enough to protect a portfolio from permanent damage due to the necessity to take withdrawals from the portfolio at the same time it has declined in value. If one needs cash in the next year, it would be wise to free it up now since the markets have recovered nicely.
A case can be made for both optimism and pessimism in the short to medium term.. On the positive side, the Federal Reserve has increased Money Supply in historic proportions (see chart below) and Congress has implemented numerous fiscal stimulus programs over the past 4 months, and more are likely, although not guaranteed.
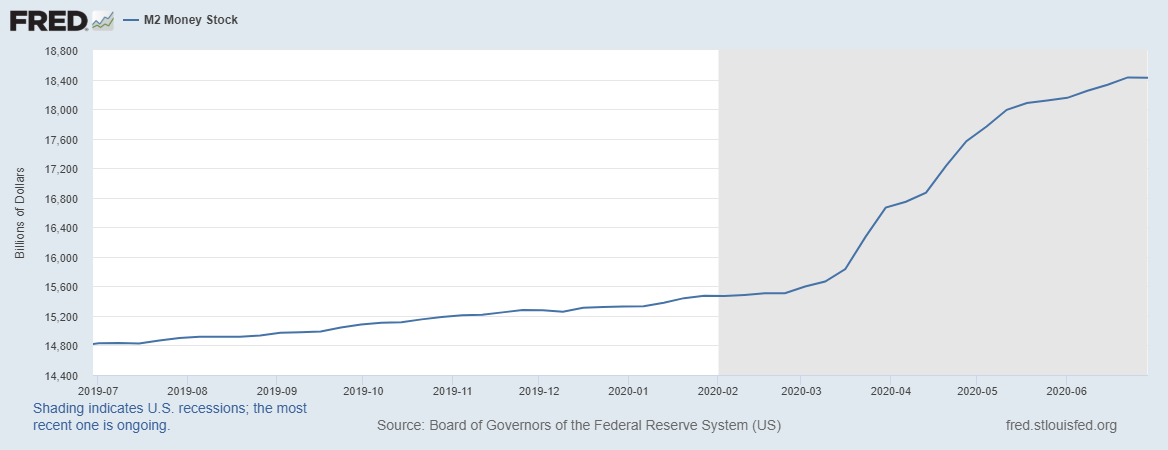
The Federal Reserve has stated:
“So let me say that we’re—we’re committed to using our full range of tools to support the economy in this challenging time. We’re going to use them, as I mentioned, forcefully, proactively, and aggressively until we’re confident that we’re solidly on the road to recovery and also to assure that that recovery, when it comes, will be as robust as possible. As long as needed, we’ll use them. And I would just say, we have a number of dimensions on which we can still provide support to the economy.”
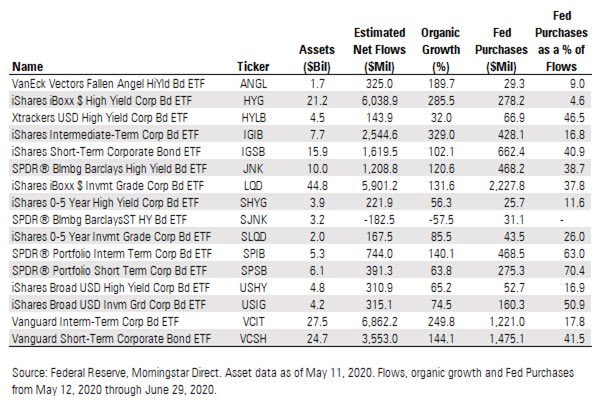
Further, the Fed is a large buyer of Bond ETFs right now. From May 12-June 29, they were responsible for up to 70% of the flows of some of those funds, as shown in the chart below. That supports the prices of the ETFs and lowers the cost of capital, and indirectly supports stock prices also.
In addition, businesses are opening back up, some faster than others.
On the downside, unemployment remains stubbornly high, and if it continues to do so, demand could be negatively impacted. Certain industries, such as travel, restaurants and gyms, are significantly below the profit levels they were before the virus struck. Bankruptcies and business failures, especially among small and medium sized businesses, are taking a toll on workers and their ability to consume in the near future. Certain states are having to shut down again as a result of more rapid spread and the stress on hospital systems in Florida, Texas, Arizona, amongst others. The big banks are taking big writedowns. Stimulus programs run out soon, and although likely, there is no guarantee new programs will be implemented due to political jockeying.
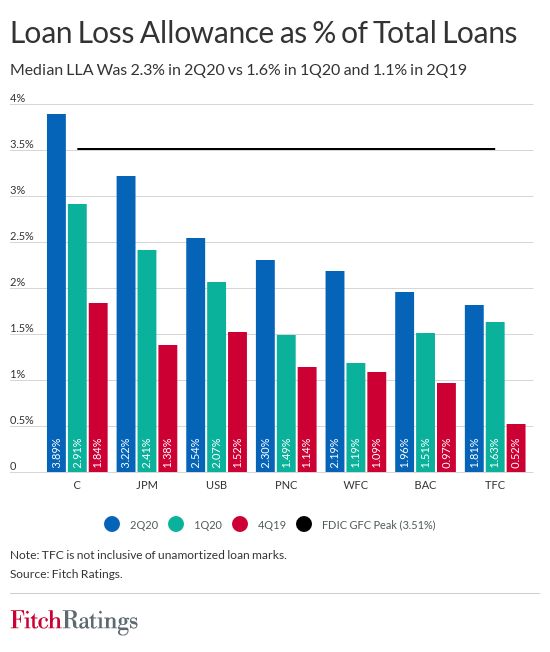
JPMorgan, Citigroup, Wells Fargo and Bank of America last week set aside almost $33 billion for bad loans in the second quarter, up almost $10 billion from last quarter, rising to a level just barely surpassed only once before, during the depths of the financial crisis in the fourth quarter of 2008. The graph below shows the increase in the loan loss provisions reported last week.
As Jamie Dimon, CEO of JP Morgan, said:
“This is not a normal recession. The recessionary part of this you’re going to see down the road. I don’t think anybody should leave any bank earnings call this quarter simply feeling like the worst is absolutely behind us and it’s a rosy path ahead. We don’t want people leaving the call simply thinking the world is a great place and it’s a V-shaped recovery.”
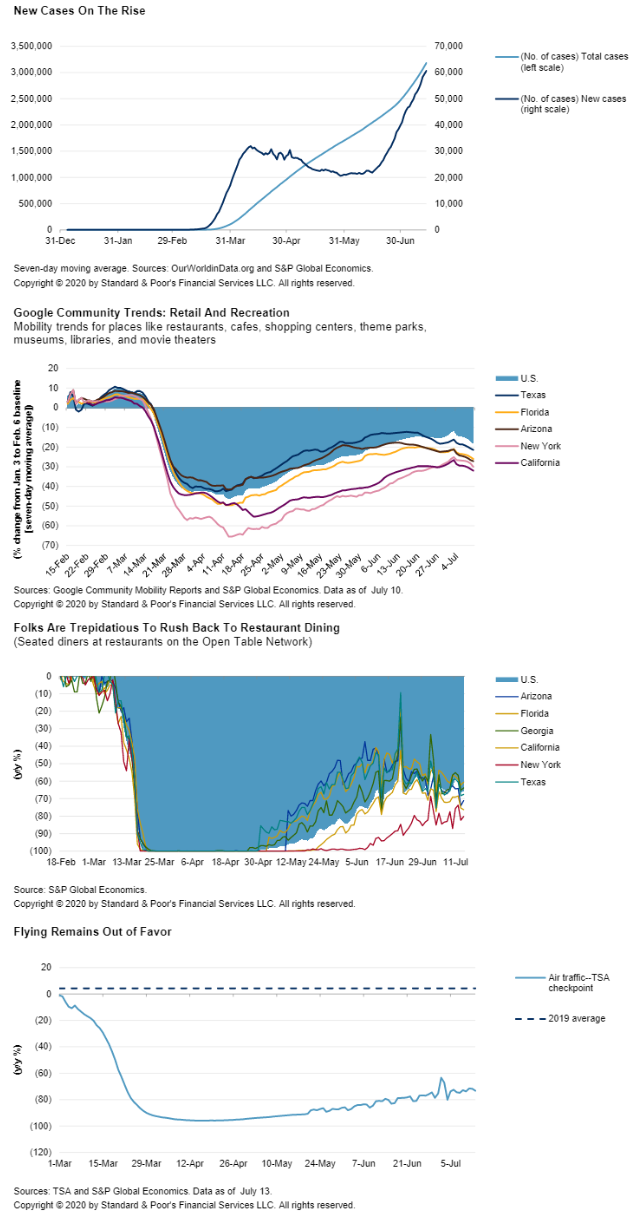
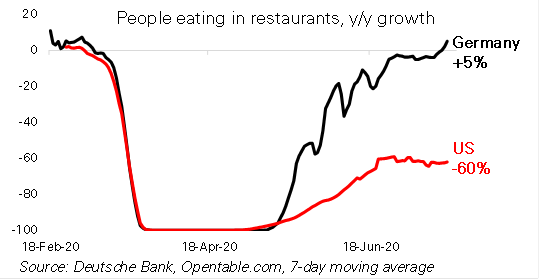
Current mobility data has shown a downturn in economic activity during the last few weeks as cases have spiked. Here are 4 graphs from an S&P report on July 16 regarding cases on the rise and economic activity being impacted in real time.
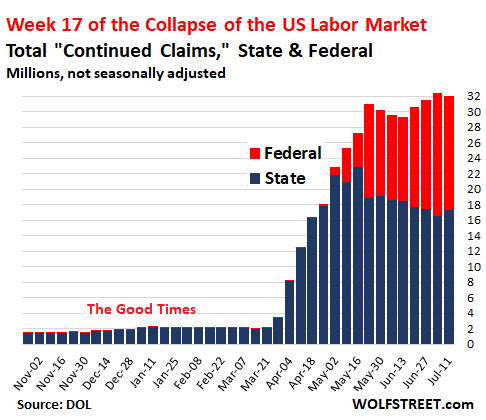
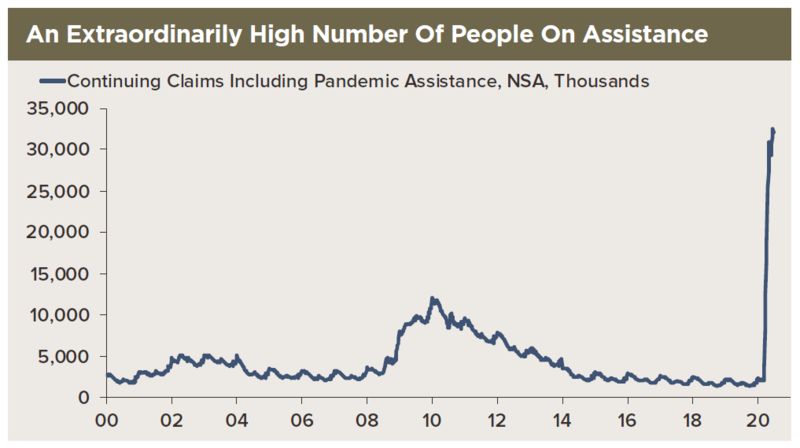
Finally, 32 million people are still receiving some type of unemployment compensation from either a state or Federal program as of July 15.
What should an investor do?
We still believe in BROAD diversification, including assets that are negatively correlated with stocks. That means Treasuries and Mortgage Backed Securities, even though those instruments are not providing much of a yield. As Christine Benz of Morningstar (@christine_benz) wrote on July 8:
“Treasury indexes were the best equity diversifiers among various bond-fund types. But while there’s the widespread perception that long-term Treasuries are the most attractive diversifiers, the recent data don’t bear this out. In fact, the shorter-term Treasury index had an even lower correlation with the S&P 500 than the long-term index. That’s a useful finding, from a portfolio livability standpoint, in that long-term Treasuries are incredibly volatile whereas the shorter-term products are much less so.”
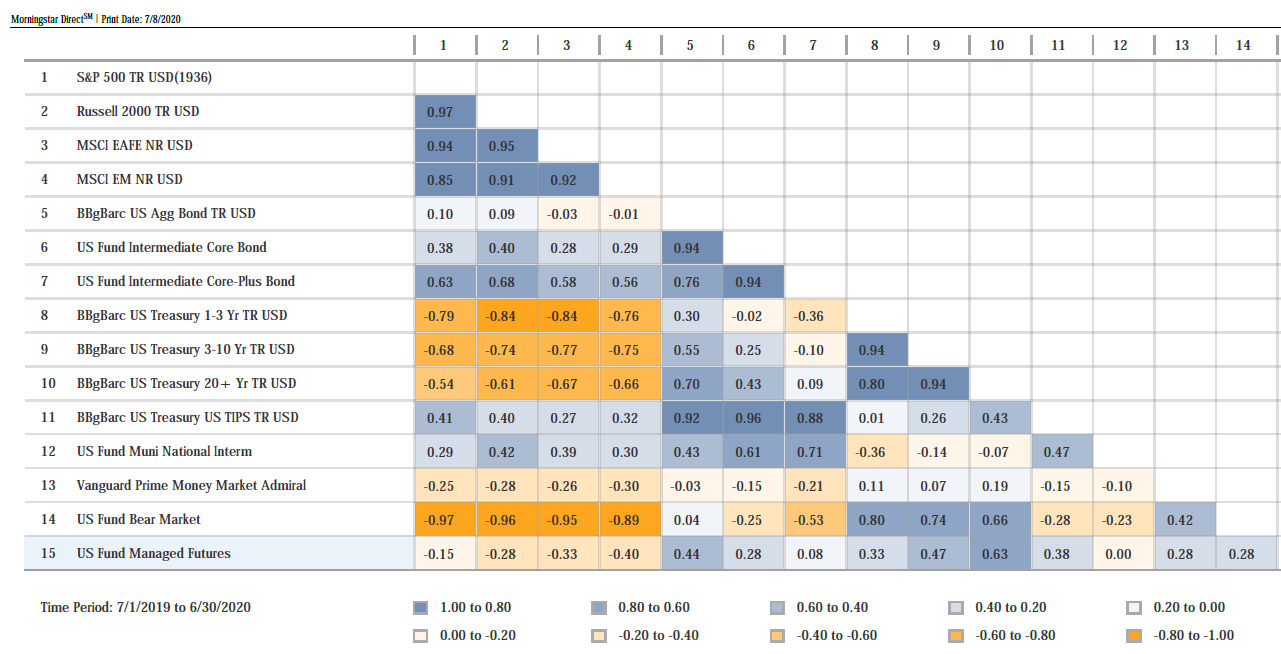
In addition to US Treasuries, we do believe in including some international bonds in the portfolio, as they are also negatively correlated with equities, and they provide protection during stock market declines.
With regard to diversification among equities, we still believe in the “factor” approach for the long-term. That means having a broad worldwide stock market exposure, and then tilting a bit more to (i) small companies, (ii) value companies, (iii) profitable and high quality companies, and (iv) companies that exhibit some short term momentum. All of these factors or dimensions of return have exhibited long-term premiums in the academic literature, and we believe premiums can be captured in low-cost mutual funds or ETFs that target those factors.
Value has underperformed growth over the past 10 years. However, we believe that the premium still exists, and it makes sense to have exposure to value, as it is at its widest disparity with growth since 1999, right before the tech bubble busted. Why do we believe this?
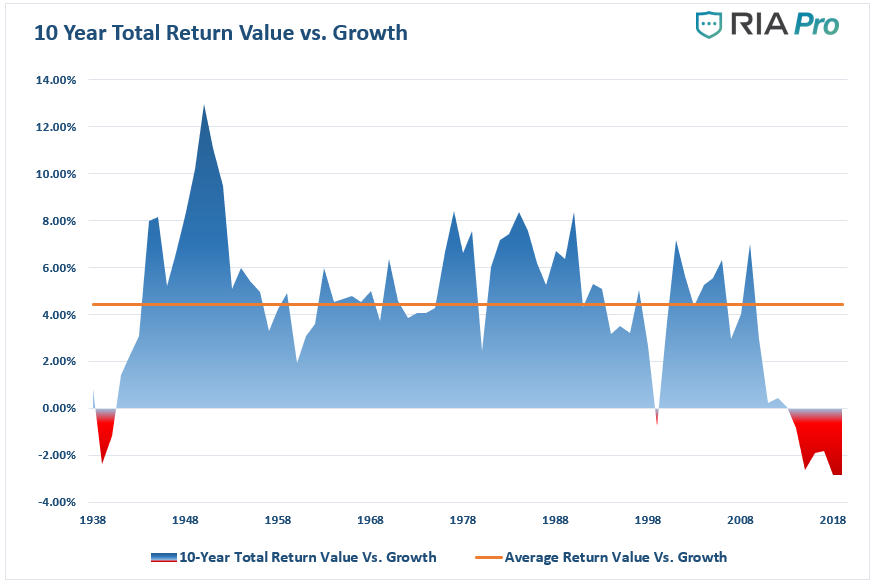
There are two critical takeaways from the graph above:
- Over the last 90 years, value stocks have outperformed growth stocks by an average of 4.44% per year (orange line).
- There have only been eight ten-year periods over the last 90 years (total of 90 ten-year periods) when value stocks underperformed growth stocks. Two of these occurred during the Great Depression and one spanned the 1990s leading into the Tech bust of 2001. The other five are recent, representing the years 2014 through 2019.
With regard to stock diversification, here is a good slide from BlackRock showing the performance of diversified stock funds versus individual stocks over the past five years. Diversification has benefits.
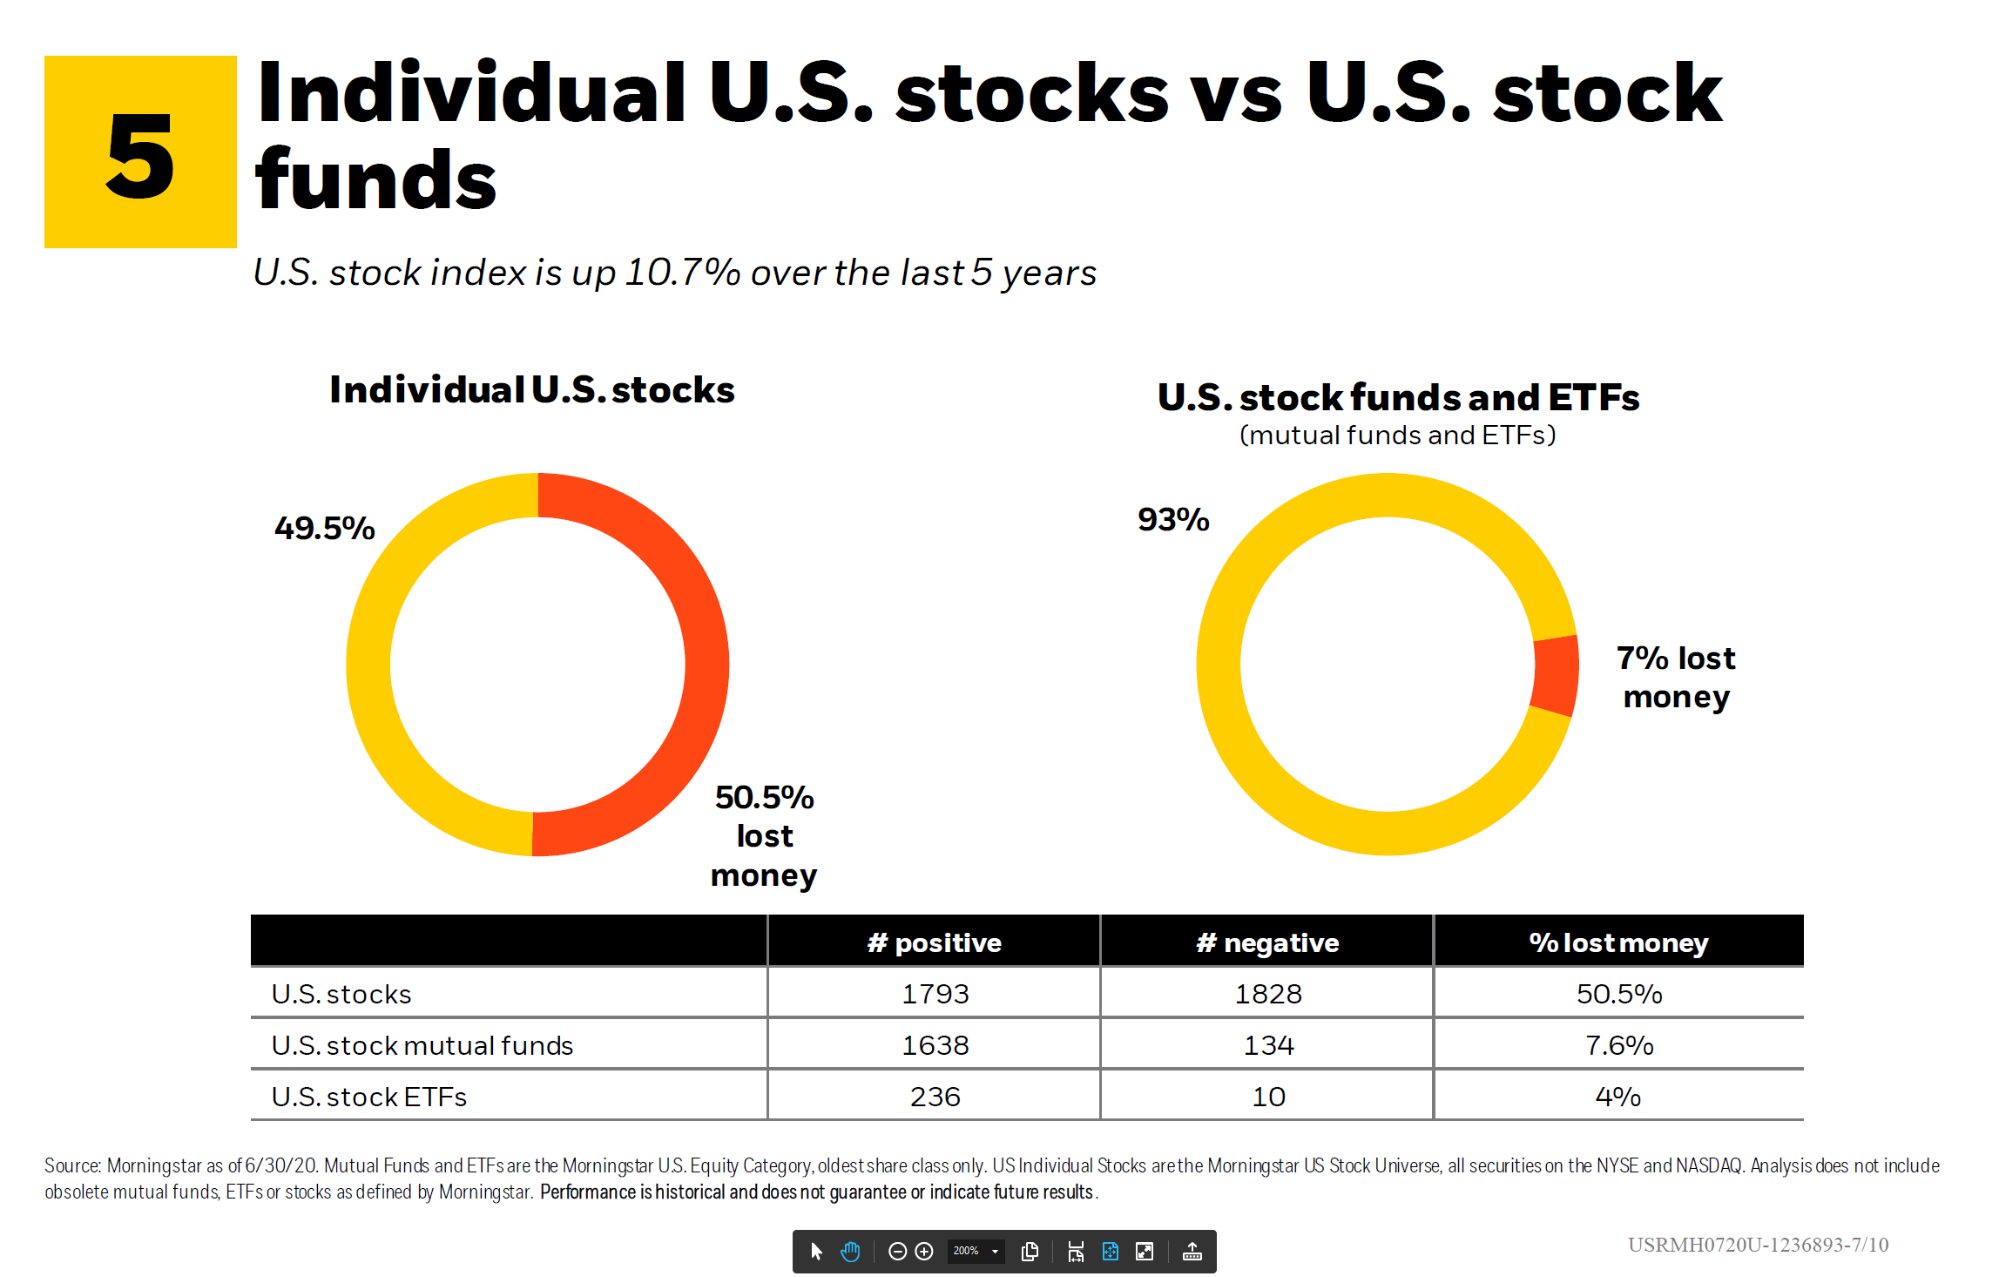
The risk of stocks is not free. There is still a chance of underperformance. As both Gene Fama and Ken French mention in their paper “Volatility Lessons” from 2018, the odds of having a negative stock market premium (meaning risk free Treasury Bills beat the stock market) are 16% over 10 years, 8% over 20 years, and 4% over 30 years. That shows stocks are risky. There is no way getting around that. Here is Professor Ken French’s site with all of the details on the different premiums over time. https://mba.tuck.dartmouth.edu/pages/faculty/ken.french/data_library.html
In the short term, being exposed to international markets or any of the other factors could lead to some underperformance as compared to the S&P 500 during certain periods of time. However, based upon long-term research, we believe that if investors are patient, the probability is that they will be rewarded with almost equivalent capital market returns at a slightly lower risk due to diversification.
With regard to bonds, we are discussing tweaking our portfolios slightly going forward over time. One change we are contemplating is adding Treasury Inflation Protected Securities (Tips) to the bond allocation. Tips compensate an investor for “unexpected” inflation over time. Regular treasuries price in “expected” inflation. However, if inflation would accelerate, a Tips holder would be compensated for any excess increase in inflation over time, better protecting purchasing power. Inflation adjusted returns are almost always more meaningful than nominal returns. Although the economy appears to be in a potentially deflationary environment right now, there is a fear among some that due to the massive increase in Federal Government debt issuance, a risk exists of inflation arising down the road. We do not know whether that will occur, but by allocating a portion of the bond portfolio to the mix, we would benefit from an increase in unexpected inflation. For a primer on Tips, here is a good link. https://www.pimco.com/en-us/resources/education/understanding-treasury-inflation-protected-securities
Buckle in. I believe we have a long way to go before we get over the Covid hump. We will remain diversified, and make sure your allocation is adequate for your wants, needs and plans. If you’d like to review your plan or anticipate cash needs in the near future please do not hesitate to reach out.
All the best,
Mike and Emily

