October 2021 Newsletter

October 15, 2021

“I take the market efficiency hypothesis to be the simple statement that security prices reflect all available information.”
Eugene Fama, Nobel Prize 2013, Efficient Capital Markets, Journal of Finance, 1991

“People make better decisions with financial advisers.”
Robert Shiller, Nobel Prize 2013

A choice of investments, portfolio or financial products ideally are the result of a plan—they’re not the plan itself. That’s why the first of Schwab’s 7 Investing Principles is “Establish a financial plan based on your goals.” Investment products—like stocks and bonds—are the tools that are used to potentially realize the goal. They’re part of a larger puzzle. A financial plan can also include retirement, insurance, tax, and estate planning, as well as strategies—such as retiring early, or saving more—that are actions, not products. Effective planners use all these tools, with the financial plan as the playbook.
Charles Schwab & Co., Inc. on Financial Planning

The third quarter was relatively flat, as shown by the returns in the indices we follow below.


Data Series as of 9/30/2021 3 Months YTD 1 Year 3 Years 5 Years 10 Years
Russell 3000 -0.10% 14.99% 31.88% 16.00% 16.85% 16.60%
S&P 500 0.58% 15.92% 30.00% 15.99% 16.90% 16.63%
Russell 2000 -4.36% 12.41% 47.68% 10.54% 13.45% 14.63%
Russell 2000 Value -2.98% 22.92% 63.92% 8.58% 11.03% 13.22%
MSCI World ex USA (net div.) -0.66% 9.19% 26.50% 7.87% 8.88% 7.88%
MSCI World ex USA Small Cap (net div.) 0.72% 10.71% 30.14% 9.50% 10.33% 10.03%
MSCI Emerging Markets (net div.) -8.09% -1.25% 18.20% 8.58% 9.23% 6.09%
Bloomberg U.S. Treasury Bond 1-5 Years 0.02% -0.46% -0.45% 3.29% 1.81% 1.45%
ICE BofA 1-Year US Treasury Note 0.02% 0.11% 0.17% 1.88% 1.46% 0.89%


To sound like a broken record, we are big believers in diversification.  The reason is that we are managing not only return, but risk in the portfolios. With proper diversification, we can increase the odds of managing risk for our clients, especially in light of achieving their goals.  Large decreases in portfolio values during retirement (known as drawdowns) can negatively impact a financial plan, as one may not have time to make up the losses from a riskier portfolio.

At present, there are numerous risks we see on the horizon. Obviously, we also want to be prepared for the risks we don’t see.

Social Security

As some of you have seen, the Social Security Trustees annual report came out recently, stating the Social Security funds are at risk of not being able to pay full benefits by 2034 or so. We realize that this is a concerning statement and are following the situation closely. It is worth noting that similar reports and headlines have come out through the years.

Social Security is funded right now by the 12.4% payroll tax, paid half by employers and half by employees.  Payroll tax income has historically exceeded the amount needed to pay benefits.  For example, in 2019, Social Security took in $1.061 trillion in taxes and spent $1.059 trillion in benefits.  The concern is that in the future, it is predicted that benefits will exceed the payroll tax, and the difference would have to be paid out of the “trust” fund, which at present has about $2.9 trillion in reserves.  If reserves continue to be used over the next 13 or so years, the projection is the reserve fund will be depleted, and only payroll tax receipts will be available to pay benefits.  That would amount to about 78% of what current payments are.

We believe between now and 2034, the government will take action to revamp social security to address this issue.  The most likely scenario is that payroll taxes will increase (doesn’t make me happy but it would not surprise me) or benefits will get paid out of general funds.  Obviously, there is a risk the government does nothing and benefits get reduced.

We model Social Security in all financial plans, and we are evaluating how to continue to model social security in the future.  We are actively talking with industry leaders to possibly adjust those models. This is why we believe the financial planning process is very important. If you are concerned about meeting all the goals of your plan, please reach out to set up an appointment to discuss.

Here are a few links to ease some of the angst.

https://www.morningstar.com/articles/1060057/social-security-isnt-going-away

https://www.cbpp.org/research/social-security/what-the-2021-trustees-report-shows-about-social-security

Current Risks

There has been no shortage of headlines (the media loves to create anxiety to increase readers/viewers) regarding risk in the market such as:

1.        The Chinese Real Estate/Debt Situation (Evergrande)

2.        The US Debt Ceiling issues, including a possible default on US Treasury obligations

3.        Inflation, especially in commodities and other inputs to goods

4.        Shipping delays and shortages

5.        Energy blackouts

In complex systems such as the markets, it is very difficult to isolate any causal relationship, as there are many factors impacting prices. Remember, however, Fama’s concept above.  “Security prices reflect all available information” at any given point in time.  We use that as a guiding principle in building portfolios for our clients, as well as managing risk.  We know the variance for stocks has been historically much higher than shorter term US government bonds, for example, and when we build the entire portfolio, we take such risk into account. We also use Fama’s concept to realize it is impossible to time the market, especially repeatedly, because not only do you have to be right when you get out, but you have to know when to get back in again.   Further, the investment function is really just a subset of financial planning.

The Benefits of Financial Planning

According to Charles Schwab’ 2021 Modern Wealth Survey (the “Survey”), only 33% of Americans have a written financial plan.  In our view, that is akin to flying blind.  Without a financial plan, can one feel confident he or she gets to the end of their life with enough money to support the goals and lifestyle they want?  Many do not think a financial plan matters.  We, Schwab, and many others think it does.

  1. A written financial plan increases confidence.  According to the Survey, 65% of the people with a written plan feel financially stable versus 40% without a written plan.
  2. A written financial plan can lead to better financial habits, including having an emergency fund, regularly rebalancing portfolios, managing portfolios in a more tax efficient way, and properly managing debt.
  3. A financial plan can help you create a risk appropriate investment portfolio for your goals.  Establishing a financial plan based upon your goals allows an advisor to use investment products such as stocks and bonds as tools to help realize your goals.
  4. In addition to the investment portfolio, a financial plan can also include retirement, education, health insurance, life insurance, disability insurance, tax and estate planning, as well as strategies, such as retiring early or saving more, that are actions, not products.  We use all of these tools to help clients reach their goals.

Research has shown that households working with a professional planner were more likely to make better financial decisions than those without a planner.   In a study published in the Journal of Financial Planning, David Blanchett, Ph.D, used six rounds of the triennial Federal Reserve Board’s Survey of Consumer Finances to examine results achieved by people using 4 information sources for financial planning advice:

  1. Financial Planners
  2. Transactional brokers, etc.
  3. Friends
  4. Internet.

“Households working with a financial planner were found to be making the best overall financial decisions, followed by those using the internet, while those working with a transactional adviser (broker) were making the worst decisions,” Blanchett wrote.

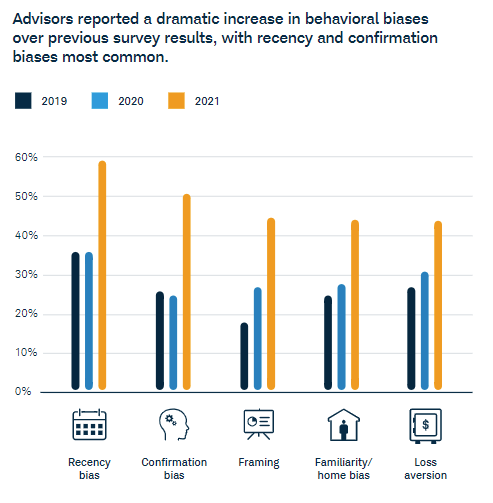
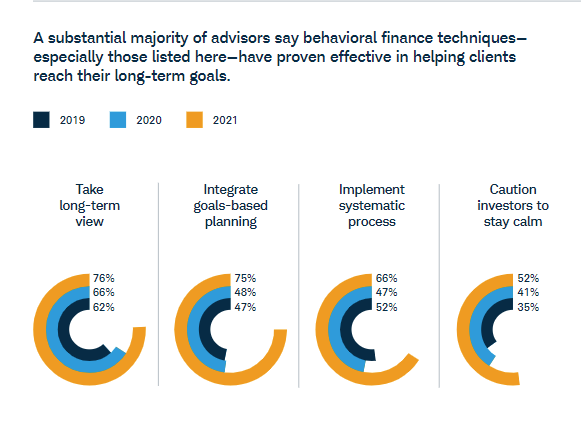
A big factor in why advisors help with health money habits is advisors help investors navigate behavioral biases, which biases are on the increase as shown in a recent 2021 survey by Cerulli Associates, in partnership with Investments and Wealth Institute and Schwab Asset Management. As you can see below, recency bias (being easily influenced by recent news events or experiences) and confirmation bias (seeking information that reinforces existing perceptions) have increased substantially among investors since 2019. 

We believe the following techniques that we have consistently used with our clients help manage such biases.

The financial planning services we provide are very important in helping clients achieve their financial goals, thereby avoiding reactive investing.

If you know anyone we could help, please let us know, and please do not hesitate to reach out with any questions.

Until next time,

Mike and Emily

July 2021 Newsletter

July 12, 2021

“Everybody talks as if they know what’s going to happen, and nobody knows what’s going to happen.”
Charlie Munger

“No one can predict the future, even bond buyers. All we have is data from the past and current market prices to make sense of things. Both of these suggest interest rates and yields will stay low. But there are some significant sources of risk ahead and reasons to think this time could be different. Current data should not convince investors to let their guard down.”
Allison Schrager

“Low-probability, high-impact events that are almost impossible to forecast—we call them Black Swan events—are increasingly dominating the environment…Instead of trying to anticipate low-probability, high-impact events, we should reduce our vulnerability to them. Risk management, we believe, should be about lessening the impact of what we don’t understand—not a futile attempt to develop sophisticated techniques and stories that perpetuate our illusions of being able to understand and predict the social and economic environment.”
Nasim Taleb, Daniel Goldstein and Mark Spitznagel


Market Summary

In a world where it is impossible to forecast, markets had a good quarter.  Below are the indices we follow.

Data Series 3 Mos 6 Mos 1 Year 3 Yrs 5 Yrs 10 Yrs St.Dev
S&P 500 8.55% 15.25% 40.79% 18.67% 17.65% 14.84% 18.63%
Russell 2000 4.29% 17.54% 62.03% 13.52% 16.47% 12.34% 19.66%
Russell 2000 Value 4.56% 26.69% 73.28% 10.27% 13.62% 10.85% 17.97%
MSCI World ex USA (net div.) 5.65% 9.92% 33.60% 8.57% 10.36% 5.70% 16.86%
MSCI World ex USA Small Cap (net div.) 4.81% 9.92% 42.28% 8.92% 11.88% 7.66% 17.97%
MSCI Emerging Markets (net div.) 5.05% 7.45% 40.90% 11.27% 13.03% 4.28% 21.51%
Bloomberg Barclays U.S. TBond 1-5 Yrs 0.10% -0.48% -0.35% 3.30% 1.77% 1.59% 3.19%
ICE BofA 1-Yr US TNote 0.02% 0.09% 0.22% 2.01% 1.47% 0.90% 1.74%

As you know, we do not try to predict in the short or even intermediate term where things are going.  We believe in markets for the long-term, but we also know that the swings can at times be large.  Combining asset classes based upon risk tolerance and needs is a more prudent long-term strategy.  No one likes the low returns on bonds above when things are running hot and up, but they are welcome when stock markets dive and there is a flight to quality. (That low standard deviation in the last column shows those assets are much less volatile).  We don’t know when those turns will occur, and we believe prudent risk management includes allocating some money to such investments.

We want to touch on the topic of inflation in this newsletter, as it has gotten a lot of attention lately.

Inflation

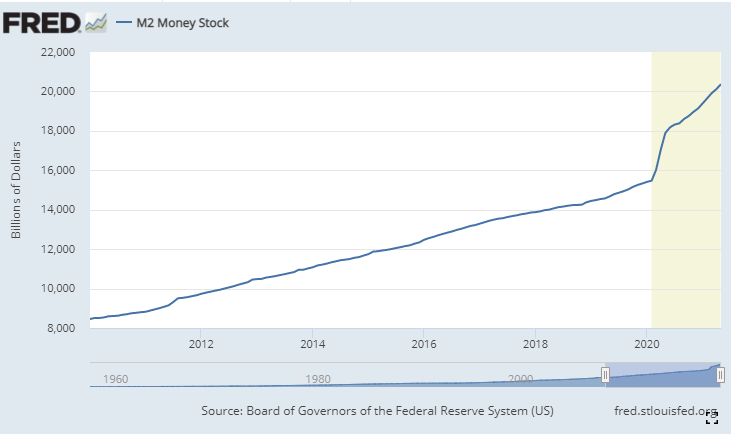
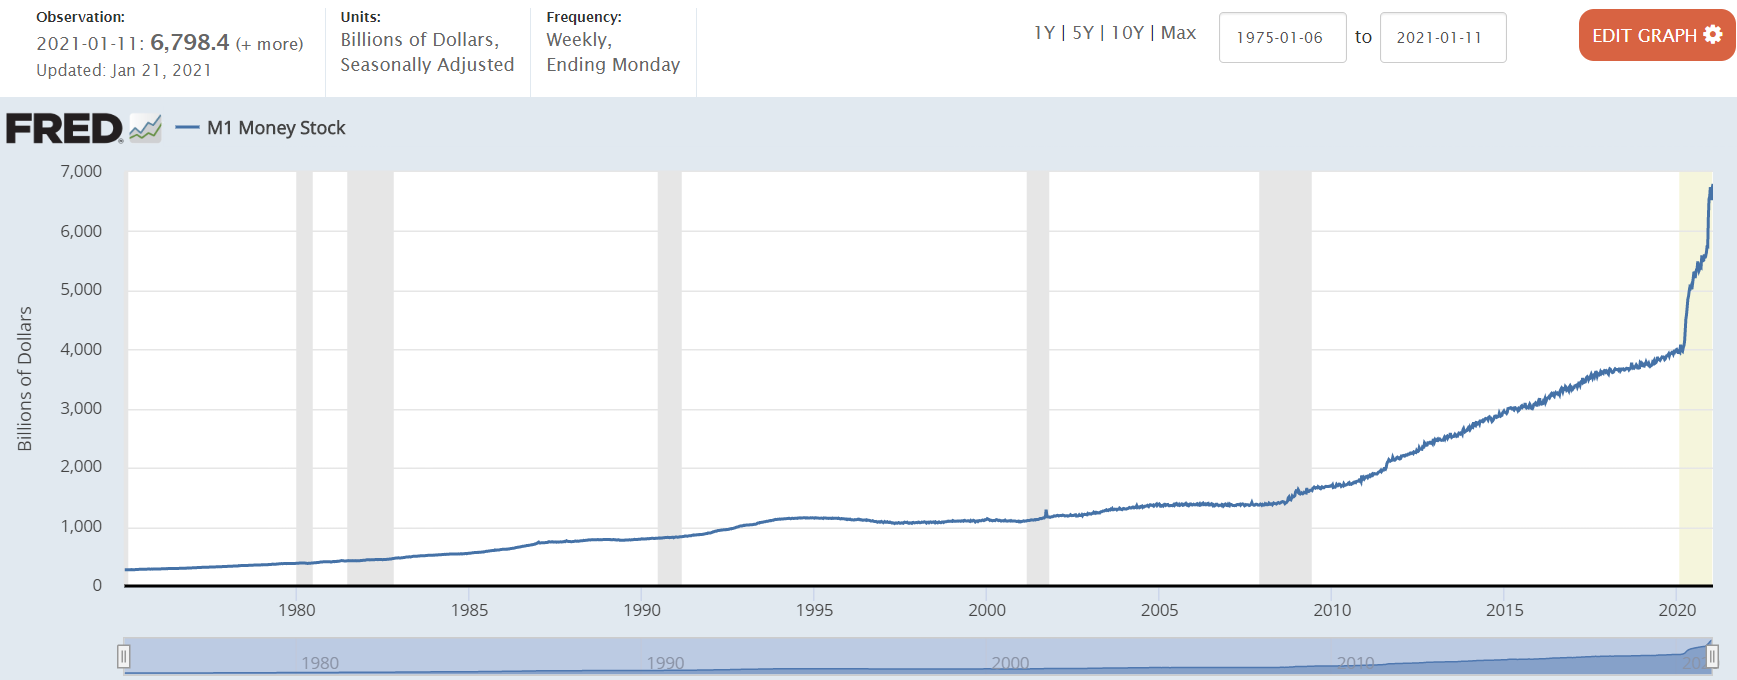
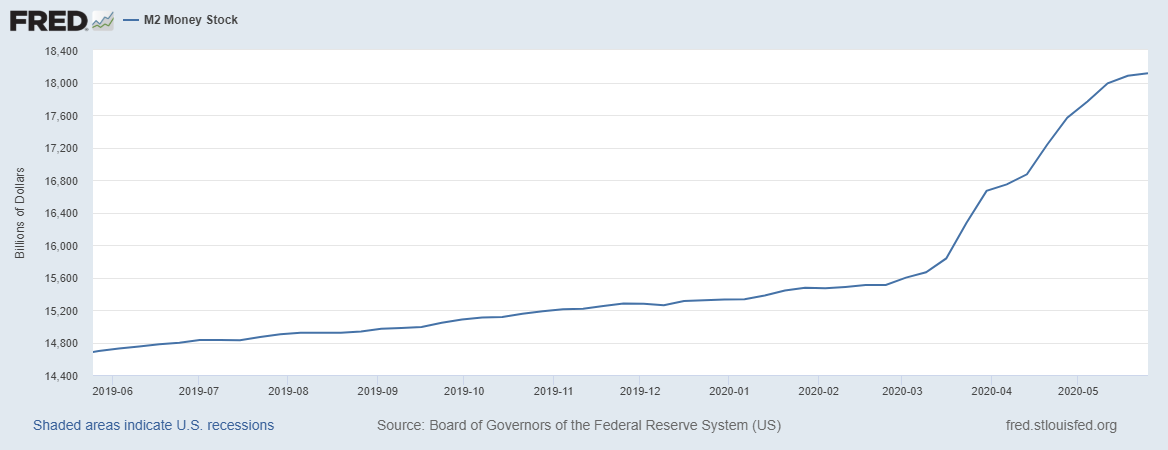
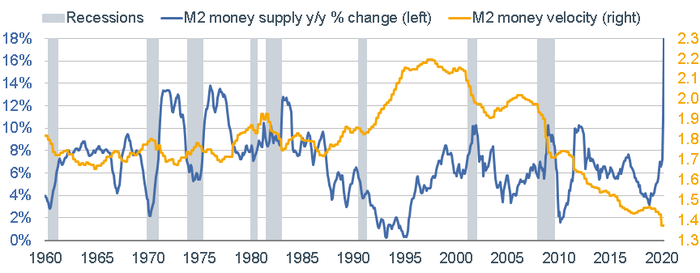
Milton Friedman, the late Professor from the University of Chicago, stated that inflation “is always and everywhere a monetary phenomenon in the sense that it is and can be produced only by a more rapid increase in the quantity of money than in output.”  Below is a picture of the increase in the quantity of money in the past year or so.

As you can see, that increase in the money supply has been very large.  The important question that is practically impossible to answer is can that increase be absorbed so it is not significantly more than an increase in output?  Since that is difficult to answer, we will address what an investor should do to minimize the risk.

Why does inflation matter?  As our friends at Avantis Investors have recently written:

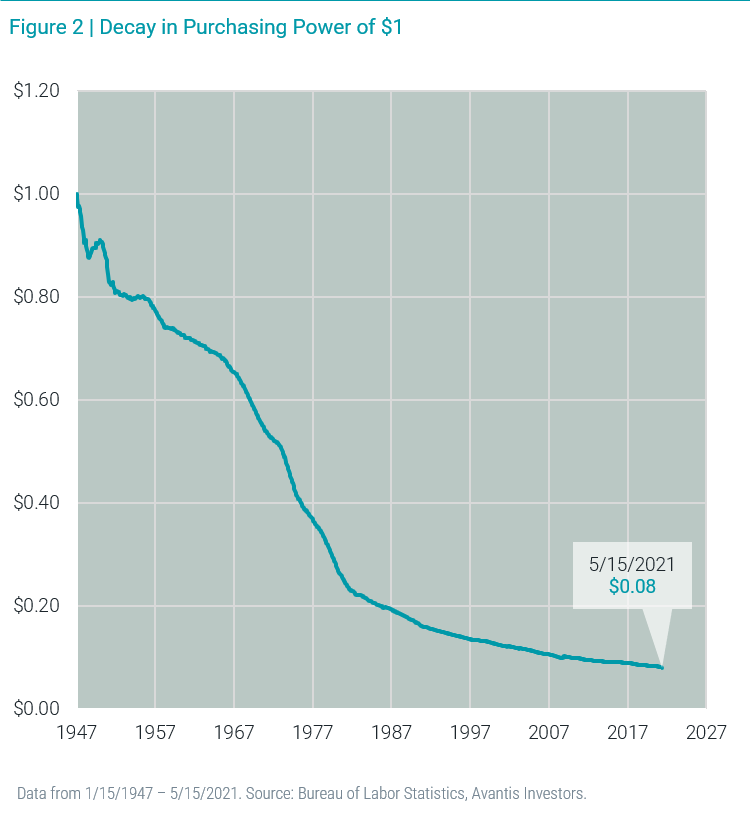
“Economist Milton Friedman was quoted as saying “inflation is taxation without legislation.” Thinking of inflation as a tax is useful because the reality is that inflation erodes your purchasing power. Said differently, $1 was able to buy more things in 1947 than it can buy today. Figure 2 shows how the purchasing power of $1 in 1947—the longest history available at the BLS website—has declined through time. Today, that same dollar buys about 8 cents’ worth of goods.”

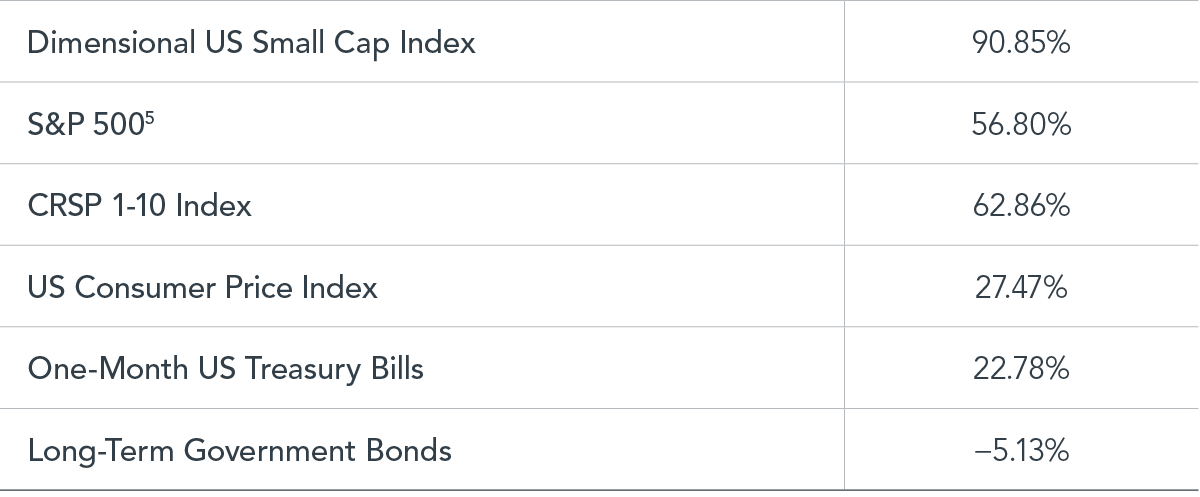
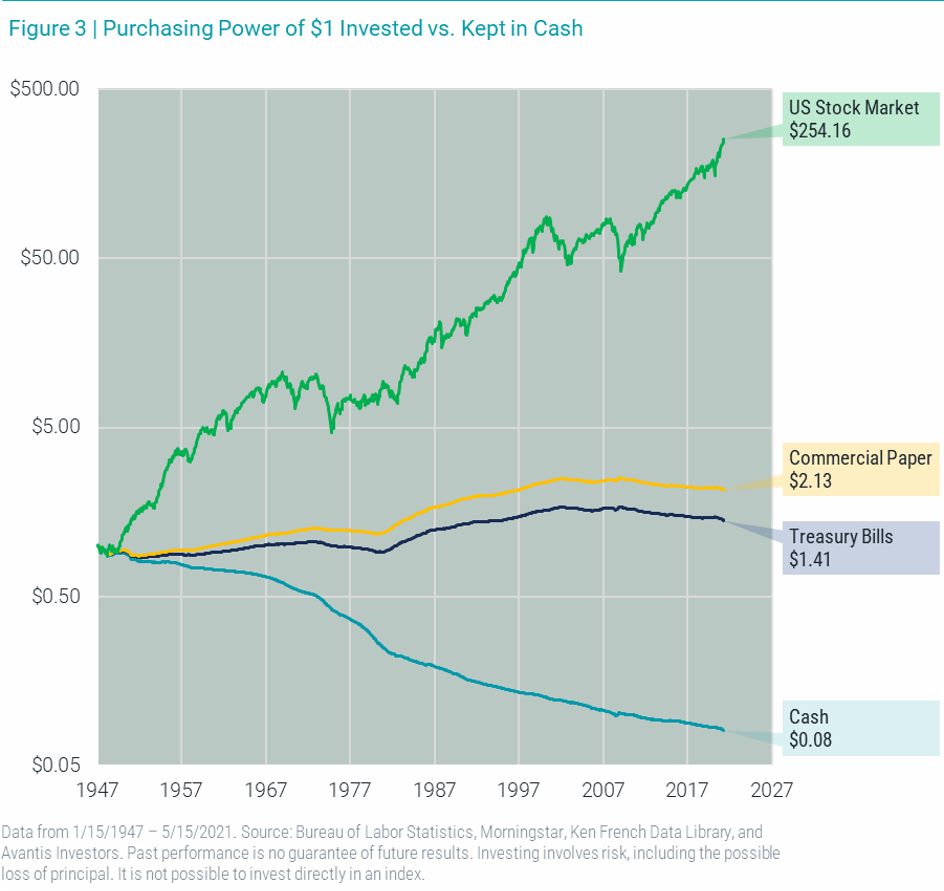
How should one deal with this in the long-term?  We believe being diversified and with some exposure to stocks and bonds is a prudent way to deal with inflation in the long-term.  Below is a chart showing cash compared to T Bills and the entire US stock market (CRSP Total Stock Market Index) since 1947.  Although treasury bills essentially kept pace with inflation, stocks increased purchasing power significantly greater than treasury bills over the long-term.

As our friends at Dimensional Fund Advisors have stated:

“Investors should know that over the long haul stocks have historically outpaced inflation, but there have also been short-term stretches where this has not been the case.”

“While stocks are more volatile than T-bills, they have also been more likely to outpace inflation over long periods. The lesson here is that volatility is not the only type of risk that should concern investors. Ultimately, many investors may need to have some of their allocation in growth investments that outpace inflation to maintain their standard of living and grow their wealth.”

“By combining the right mix of growth and risk management assets, investors may be able to blunt the effects of inflation and grow their wealth over time.”

Nobel Prize winning professor Gene Fama and Ken French wrote in their blog:

“Short-term high grade bonds are a good hedge against inflation. If hedging inflation is your overriding goal, short-term high grade bonds are the route for you. (Gene has been saying this for about 40 years.) But don’t expect much in the way of a real return. Short-term bonds maintain purchasing power, but they don’t enhance it, since the real returns they produce are quite low (for example, less than 1% per year on T-bills). In other words, if you don’t take much real risk, you can’t expect much real return.”

Treasury inflation protected securities (“TIPS”) are also a good diversifier.  They essentially compensate you for “unexpected” inflation.  As inflation (measured by the consumer price index) rises, so does the par value of TIPS, while the interest rate remains fixed. This means that if inflation unexpectedly rises, the purchasing power of any principal invested in TIPS should also increase, although again, without much real return.  Again, it is stocks over the long-haul that have provided the “real” return that has increased  wealth.

What about commodities?  Inmoo Lee and Marlena Lee of Dimensional did some research on that.  “Commodities, gold, and oil are unlikely to deliver the high returns and substantial diversification benefits that some proponents have claimed. Economic theory does not provide a compelling argument that says these alternative assets should have high expected returns. Additionally, because these assets have such large return variances, adding them to a typical stock and bond portfolio is likely to increase, rather than decrease, the real-return volatility of the overall portfolio.”

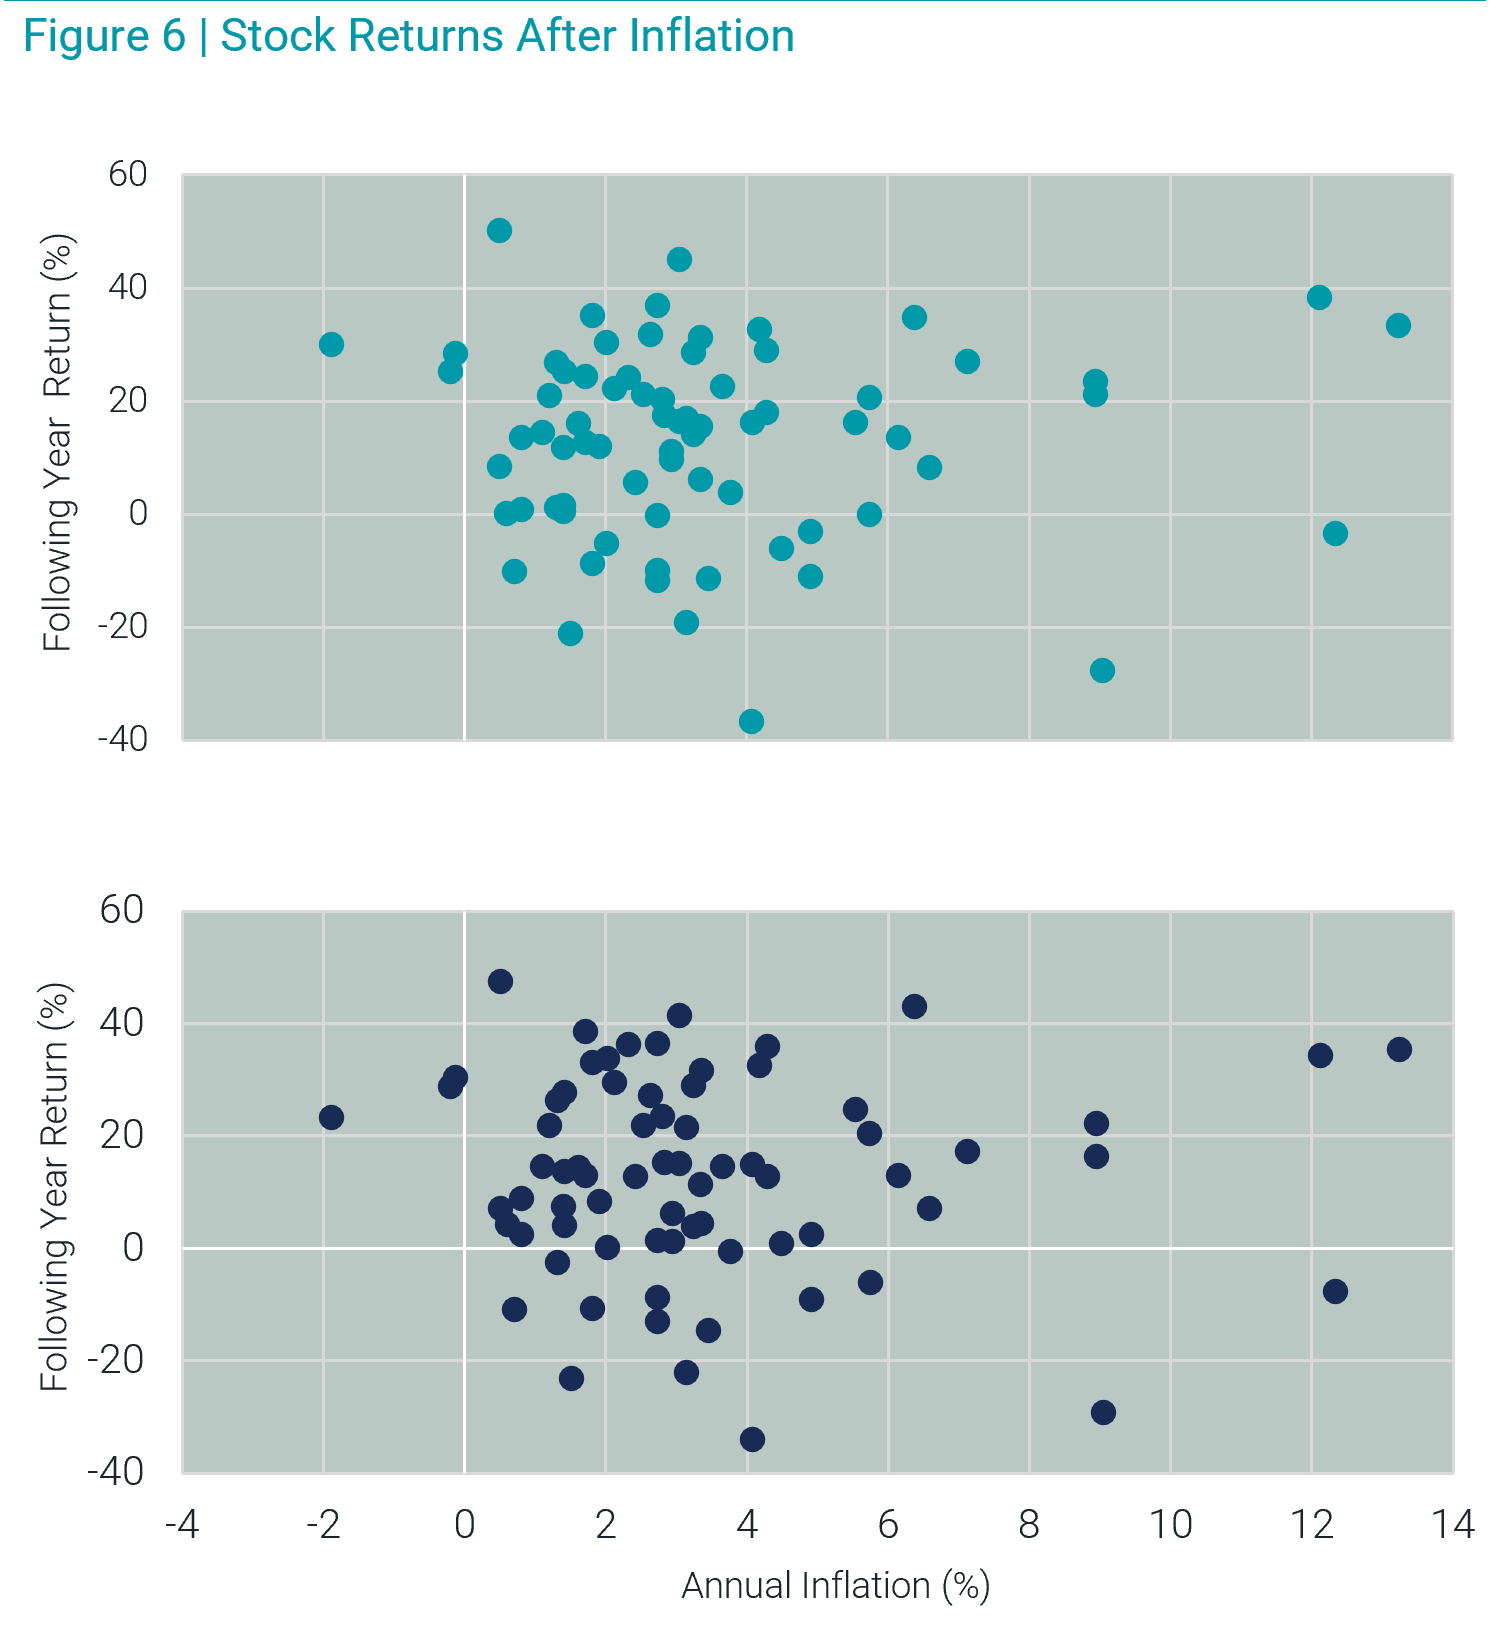
Does a rise in inflation predict poorer stock returns?  Avantis Investors ran a simple experiment comparing a previous year’s inflation data’s impact on the next year’s stock returns. The top chart shows the US Stock Market, and the bottom shows small cap value.  The relation was very weak, meaning if you “were trying to use this year’s inflation level to predict next year’s stock market return, you’d probably be relying on luck more than anything else.”  There is not much predictive ability of current inflation rates on future stock returns.

Our goal at McCartney Wealth Management on behalf of our clients is to combine the right mix of assets to blunt the effects of inflation for our clients while growing their wealth over time. We also want to practice prudent risk management in case the equity markets suffer a setback similar to the Great Financial Crisis. By being properly diversified, including in the right asset allocations for the long-term, we believe we increase our odds of achieving that goal.

As Dimensional points out, “inflation is only one consideration among many that investors must contend with when building a portfolio for the future. The right mix of assets for any investor will depend upon that investor’s unique goals and needs. A financial advisor can help investors weigh the impact of inflation and other important considerations when preparing and investing for the future.”

Investing is actually very complicated, as we have witnessed in 2007-2009, 2018 and 2020.  Not only does one have to deal with uncertainty, expected returns, inflation, and interest rates, but one also has to wrestle with the emotional side of investing, especially when markets plummet from time to time due to some economic or world crisis that develops.  We have no idea whether inflation, and especially unintended inflation, is going to occur.  We are here to help you prepare and invest for the future, balancing inflation, growth, risk management, and behavioral finance for a better long-term outcome and experience.

Until next time,

Mike and Emily

April 2021 Newsletter

April 20, 2021

“Well, bitcoin is a currency. Bitcoin has no underlying rate of return. You know, bonds have an interest coupon. Stocks have earnings and dividends. Gold has nothing, and bitcoin has nothing. There is nothing to support bitcoin except the hope that you will sell it to somebody for more than you paid for it.”
John Bogle

“It is one thing to think gold has some marvelous store of value because man has no way of inventing more gold or getting it very easily, so it has the advantage of rarity. Believe me, man is capable of somehow creating more bitcoin… They tell you there are rules and they can’t do it. Don’t believe them.”
Charlie Munger

“Bitcoin is a way to have programmable scarcity. The blockchain is the data structure that records the transfer of scarce objects.”
Balaji Srinivasan

“Think of Bitcoin as a bank account in the cloud, and it’s completely decentralized: not the Swiss government, not the American government. It’s all the participants in the network enforcing.”
Naval Ravikant

It has been an interesting past year for sure.  I am going to share the indices we follow below.  The equity markets continued to perform well in the first quarter as shown below. However, we continue to be big believers in diversification.  I saw a great quote from Adam Grossman on his blog Humble Dollar touting the benefits of diversification in a very eloquent way.

“Markowitz’s fundamental insight—for which he won a Nobel Prize—does carry a key lesson for every investor: Correlations are paramount. I can’t tell you when or if the stock market will see a correction. But the good news is, you don’t need to worry about building a strictly optimal portfolio, in the textbook sense, to protect yourself. You just need a sensible mix of stocks, bonds and other asset classes that aren’t tightly correlated. As you think about your portfolio and the risk posed by today’s stock prices, this is, I think, the most important thing.”


Data Series 3 Months 1 Year 3 Years 5 Years 10 Years
S&P 500 6.17% 56.35% 16.78% 16.29% 13.91%
Russell 2000 12.70% 94.85% 14.76% 16.35% 11.68%
Russell 2000 Value 21.17% 97.05% 11.57% 13.56% 10.06%
MSCI World ex USA (net div.) 4.04% 45.86% 6.34% 8.92% 5.21%
MSCI World ex USA Small Cap (net div.) 4.88% 65.17% 6.89% 10.55% 7.14%
MSCI Emerging Markets (net div.) 2.29% 58.39% 6.48% 12.07% 3.65%
Bloomberg Barclays U.S. T Bond 1-5 Years -0.59% -0.05% 3.30% 1.91% 1.73%
ICE BofA 1-Year US T Note 0.07% 0.17% 2.14% 1.52% 0.92%

As you can see, small cap US (Russell 2000) and small cap value US (Russell 2000 Value) have performed very well last quarter.  Since we tilt to small and value a bit more in our portfolios, that outperformance over the S&P 500 definitely helped our portfolios. That sensible allocation we believe helps portfolios in the long-term.

Bitcoin

We have been getting a lot of questions about Bitcoin and cryptocurrencies in general.   Normally, we draft our own content in our newsletter. However, when we see something from one of our fund companies that is clear, we like to share that with you.  I am going to share a piece regarding cryptocurrencies from Dimensional Fund Advisors, as well as a link from Avantis Investors.  As you can see by the quotes at the beginning, I balanced 2 more pessimistic views versus 2 more optimistic views.  We do not know which outcome will prevail.  However, we do know that technology evolves, and that alone gives us pause that Bitcoin will be the winner in the end.

We presently see investing in cryptocurrencies as more of a speculation play than an investment. We view investing as the holding of companies in which we expect a return in the form of earnings, dividends and capital appreciation in stocks, and interest and return of principal in bonds.. (See Bogle’s quote at the beginning). While we do not speculate in portfolios at McCartney Wealth Management, we realize some clients like to speculate on the side. We would advise to speculate only with a small portion of your portfolio if you are going to do so.

Bitcoin is popular because it was one of the first cryptocurrencies to come out of blockchain technology. Being one of the first does not mean it will prevail.. A big piece of Bitcoin’s perceived value is that it is a decentralized currency, without regulation. In order for many companies and banks to support cryptocurrencies, there will need to be regulation due to laws around money laundering, which could potentially dilute the perceived value, or cause other cryptos to be adopted over Bitcoin. No one knows if Bitcoin is in a bubble or will be broadly accepted as a form of currency in the future.

In looking at some of the bigger bank and payment processing companies’ statements on cryptos, they are generally vague on Bitcoin, but in theory can/will support cryptos in the future. This language leaves the support open to a broader range of cryptocurrencies and the blockchain in general, but not necessarily Bitcoin.

Below are what we perceive to be the pros and cons of Bitcoin and cryptocurrencies at present.

Pros:

  • Some see Bitcoin or other cryptocurrencies as a diversification in currency or hedge against inflation

Cons:

  • Unregulated currency – there are no legal rights should something go wrong
  • Cryptocurrency prices are subject to wide fluctuations
  • There was no central market for pricing (although this is starting to change with Coinbase)
  • Currently limited means of exchange, and may be difficult to liquidate quickly at a reasonable price
  • Possible security issues, as exchanges and platforms are subject to breaches, especially if quantum computers become mainstream Quantum computers and the Bitcoin Blockchain | Deloitte Netherlands

Below is a piece by Weston Wellington of Dimensional Fund Advisors regarding Bitcoin and cryptocurrencies.  If you want to read the piece at Dimensional’s site, the link is here.  Tales from the Crypto: How to Think About Bitcoin

If you want to read another view, Meir Statman, the Glenn Klimek Professor of Finance at Santa Clara University and a consultant to our friends at Avantis Investors, published this short piece Bitcoin Lessons in Hindsight, Aspirations and Risk | Avantis Investors

Enjoy.  Until next time,

Mike and Emily

Tales from the Crypto: How to Think About Bitcoin

By Weston Wellington Vice President

“Everything you don’t understand about money combined with everything you don’t understand about computers.”—HBO’s Last Week Tonight with John Oliver, March 11, 2018

Bitcoin and related cryptocurrencies (now numbering in the thousands) are the subject of much debate and fascination. Given Bitcoin’s dramatic price changes, it is not surprising that many are speculating about its possible role in a portfolio.

EXHIBIT 1

Price of Bitcoin for the last 10 years, March 2011–February 2021
Past performance is not a guarantee of future results.

In its relatively short existence, Bitcoin has proved extraordinarily volatile, sometimes gaining or losing more than 40% in price in a month or two. Any asset subject to such sharp swings may be catnip for traders but of limited value either as a reliable medium of exchange (to replace cash) or as a risk-reducing or inflation-hedging asset in a diversified portfolio (to replace bonds).

Assessing the merits of Bitcoin as an investment can be problematic. Adding it to a portfolio could mean paring back the allocation to investments such as stocks, property, or fixed income. The owner of stocks or real estate generally expects to receive future income from dividends or rent, even though the size and timing of the payoff may be uncertain. A bondholder generally expects to receive interest payments as well as the return of principal. In contrast, holding Bitcoin is similar to holding gold as an investment. Even if Bitcoin or gold are held for decades, the owner may never receive more Bitcoin or gold, and unlike stocks and bonds, it is not clear that Bitcoin offers investors positive expected returns.

Putting aside squabbles over the future value of Bitcoin or other cryptocurrencies, there are other issues investors should consider:

  • Bitcoin is not backed by an issuing authority and exists only as computer code, generally kept in a so-called “digital wallet,” accessible through a password chosen by the user. Many of us have forgotten or misplaced computer passwords from time to time and have had to contact the sponsor to restore access. No such avenue is available to holders of Bitcoin. After a limited number of password attempts, a user can permanently lose access. Since there is no central authority responsible for Bitcoin, there is no recourse for the forgetful owner: a recent New York Times article profiled the holder of more than $200 million worth of Bitcoin that he can’t retrieve. His anguish is apparently not unusual—a prominent cryptocurrency consulting firm estimates that 20% of all outstanding Bitcoin represents stranded assets unavailable to their rightful owners.1
  • Mt. Gox, a Tokyo-based Bitcoin exchange launched in 2010, was at one time the world’s largest Bitcoin intermediary, handling over one million accounts in 239 countries and more than 90% of global Bitcoin transactions in 2013. It suspended trading and filed for bankruptcy in February 2014, announcing that hundreds of thousands of Bitcoins had been lost and likely stolen.2
  • The UK Financial Conduct Authority cited a number of concerns as it prohibited the sale of “cryptoasset” investment products to retail investors last year. Among them were the inherent nature of the underlying assets, which have no reliable basis for valuation; the presence of market abuse and financial crimes in cryptoasset trading; extreme price volatility; an inadequate understanding by retail consumers of cryptoassets; and the lack of a clear investment need for investment products referencing them.

The financial services industry has a long tradition of innovation, and cryptocurrency and the technology surrounding it may someday prove to be a historic breakthrough. For those who enjoy the thrill of speculation, trading Bitcoin may hold appeal. But those in search of a sound investment should consider the concerns of the Financial Conduct Authority above before joining the excitement.
______________________________________________________

FOOTNOTES

  1. Nathaniel Popper, “Lost Passwords Lock Millionaires Out of Their Bitcoin Fortunes,” New York Times, January 12, 2021.
  2. Alexandra Harney and Steve Stecklow, “Twice Burned – How Mt. Gox Bitcoin Customers Could Lose Again,” Reuters, November 16, 2017.
  3. “Prohibiting the sale to retail clients of investment products that reference cryptoassets,” Financial Conduct Authority, June 10, 2020.

DISCLOSURES

The opinions expressed are those of the author and are subject to change. The commentary above pertains to Bitcoin cryptocurrency. Certain Bitcoin offerings may be considered a security and may have different attributes than those described in this paper. Dimensional does not offer Bitcoin.

This material is not to be construed as investment advice or a recommendation to buy or sell any security or currency. Investing involves risks including possible loss of principal. Stocks are subject to market fluctuation and other risks. Bonds are subject to increased risk of loss of principal during periods of rising interest rates and other risks. There is no assurance that any investment strategy will be successful. Diversification does not assure a profit or protect against loss.

The information in this document is provided in good faith without any warranty and is intended for the recipient’s background information only. It does not constitute investment advice, recommendation, or an offer of any services or products for sale and is not intended to provide a sufficient basis on which to make an investment decision. It is the responsibility of any persons wishing to make a purchase to inform themselves of and observe all applicable laws and regulations. Unauthorized copying, reproducing, duplicating, or transmitting of this document are strictly prohibited. Dimensional accepts no responsibility for loss arising from the use of the information contained herein.

“Dimensional” refers to the Dimensional separate but affiliated entities generally, rather than to one particular entity. These entities are Dimensional Fund Advisors LP, Dimensional Fund Advisors Ltd., Dimensional Ireland Limited, DFA Australia Limited, Dimensional Fund Advisors Canada ULC, Dimensional Fund Advisors Pte. Ltd., Dimensional Japan Ltd., and Dimensional Hong Kong Limited. Dimensional Hong Kong Limited is licensed by the Securities and Futures Commission to conduct Type 1 (dealing in securities) regulated activities only and does not provide asset management services.

UNITED STATES: Dimensional Fund Advisors LP is an investment advisor registered with the Securities and Exchange Commission.

Year End Newsletter 2020

January 29, 2021

“A man who carries a cat by the tail learns something he can learn in no other way.”
Mark Twain

“I remind myself of Einstein’s remark that common sense is nothing but a collection of misconceptions acquired by age eighteen.”
Nassim Taleb, from book Fooled by Randomness

“Success breeds a disregard of the possibility of failure.”
Hyman Minsky, Former professor of economics at Washington University in St. Louis


2020 was unique in so many ways.  We had a once in a one-hundred-year pandemic, which is still not over.  We had a stock market that started to crash in a rapid fashion starting in February, and then rebounded strongly starting in April after both the Federal Reserve and Congress flooded the economy with liquidity from March onward (see graph below on M1 Money Stock), with the Federal Reserve buying all sorts of risk assets except stocks, but including high yield junk bonds, which act a LOT like stocks.  The Treasury department delivered significant stimulus checks to both individuals and businesses as COVID-19 lockdowns occurred.  And the nation went through a difficult election and post-election process, which is also not completely over.


Even though the stock market ended up having a good year on a calendar year basis, risk and uncertainty existed throughout 2020 and still exists.  Although some people think that risk has been eliminated by the Federal Reserve and the Treasury Department, other experts would disagree.  In complex systems such as financial markets, risk is always there, and markets can change very quickly as evidenced in February.  Prices are information, and when prices or interest rates arguably get distorted, that means information is also distorted.  Distorted information can lead to a misallocation of resources in a market-based economy, such as inflated stock and home prices.  Or as Hyman Minsky stated, “stability leads to instability.”

As mathematician Benoit Mandelbrot has said, “there is something in the human condition that abhors uncertainty, unevenness, unpredictability. People like an average to hold onto, a target to aim at—even if it is a moving target.”  As Mandelbrot’s friend Nassim Taleb wrote in Fooled by Randomness, “Probability is not a mere computation of odds on the dice or more complicated variants; it is the acceptance of the lack of certainty in our knowledge and the development of methods for dealing with our ignorance.”  From a market perspective, one of those methods for dealing with ignorance of where markets will go is diversification, or not having all our eggs in one basket.  From a true “investing” standpoint, it is better to have assets spread over different asset classes versus picking only one asset class.  Picking one is a bet – or speculation – not investing.

Multiple studies have shown that humans are generally risk averse.   On the flip side, investors also suffer regret if they miss out on a move higher.  As Taleb points out “past events will always look less random than they were…Psychologists call this overestimation of what one knew at the time of the event due to subsequent information the hindsight bias, the “I knew it all along” effect.”  Danny Kahneman stated, “you should also know that regret and hindsight bias will come together, so anything you can do to preclude hindsight is likely to be helpful.”  Unfortunately, in the investment space, that is a difficult task.

Taleb takes a hardline approach.

“Say you engage in a business of protecting investors from rare events by constructing packages that shield them from their sting (something I have done on occasion). Say that nothing happens during the period. Some investors will complain about your spending their money; some will even try to make you feel sorry: “You wasted my money on insurance last year; the factory did not burn, it was a stupid expense. You should only insure for events that happen.” One investor came to see me fully expecting me to be apologetic (it did not work). But the world is not that homogeneous: There are some (though very few) who will call you to express their gratitude and thank you for having protected them from the events that did not take place.”

When we protect capital, we still feel somewhat badly if the market went the other way.  However, we do not feel badly about protecting the portfolio from massive uncertainty when a once in one-hundred-year event occurs.

Last year, especially with some of our investors getting closer to retirement and with the massive uncertainty regarding the pandemic and the economy, preserving capital for that demographic was very important.  Normally it takes a relatively long time to make money, and much less time to lose it.  We do not believe one can persistently and consistently time markets.  However, we do believe that we can protect capital in times of great uncertainty; and we also believe that doing so makes more sense than taking extraordinary risk and possibly blowing up a financial plan.  As Taleb states, “considering that alternative outcomes could have taken place, that the world could have been different, is the core of probabilistic thinking,” a belief we share.  Just because an alternative did not occur does not mean it was not in the probability of outcomes that could have occurred.

Our planning software, MoneyGuidePro, estimates returns and standard deviations for different portfolios going forward based upon a stock/bond allocation.    Below are the current projections.  That is all they are, and disclosures are here.

Name Cash Bond Stock Projected Return Standard Deviation 2 Std Dev Down from Avg 2 Std Dev Up from Avg
Capital Preservation I 5% 67% 28% 4.05% 4.85% -5.65% 13.75%
Capital Preservation II 5% 57% 38% 4.43% 6.43% -8.43% 17.29%
Balanced I 4% 51% 45% 4.69% 7.51% -10.33% 19.71%
Balanced II 4% 42% 54% 5.03% 8.96% -12.89% 22.95%
Total Return I 4% 35% 61% 5.36% 10.25% -15.14% 25.86%
Total Return II 3% 25% 72% 5.79% 12.07% -18.35% 29.93%
Capital Growth I 2% 16% 82% 6.20% 13.79% -21.38% 33.78%
Capital Growth II 0% 9% 91% 6.57% 15.31% -24.05% 37.19%
Equity Growth 0% 0% 100% 6.93% 16.83% -26.73% 40.59%


The most important thing to understand is that a normal return (95% of the time) in any given year is the range of 2 standard deviations from the average, down or up.  The riskier (greater the percentage of stock) the portfolio, the greater the portfolio strays from the average in any given year.  For a diversified 100% stock portfolio according to MoneyGuidePro’s planning models, if you had a -26.73% return in a calendar year, that would be considered normal based upon the standard deviation.

That range of returns shows the randomness of returns.  Because returns are “fat tailed,” meaning there are more outliers than we would expect by the statistics above, the range of returns for each of the portfolios is even greater in real life than shown in the model above.  Remember, models help us understand real world phenomena, but they are solely models, and not reality.

Below is another chart that shows how short-term treasuries, intermediate term treasuries and the S&P 500 did in 2 different difficult market scenarios, including the financial crisis of 2007-2009.

In the great recession of 2007-2009, the S&P 500 declined 51% in 16 months, which was extremely painful for investors solely concentrated in that index. As you can see, there was a flight to quality to Treasury Bills and Bonds during that period and diversifying and holding some of those assets in the portfolio would have cushioned the fall.

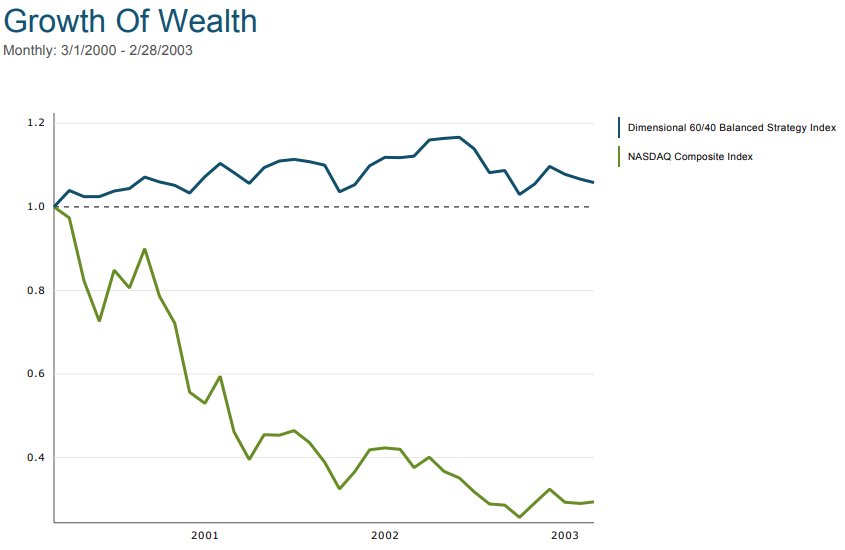
From March 1, 2000 – February 28, 2003, the Nasdaq Composite Index* (one cannot buy an index, but one can buy a low cost fund tracking the index), which tracks many tech stocks, fell 71%.  $1,000,000 turned into $290,000.

Assume you had a financial plan based upon “betting” on the Nasdaq Index, and that -71% randomness occurred while you needed to pull $100,000 out of the portfolio. The financial plan could have been ruined.  Instead, compare that to the Dimensional 60/40 Balanced Strategy Index*, a much more diversified index, which was up 5.82% cumulatively in the same period.  Although only a 1.9% annualized return over 3 years, it would have been much better to have $1,060,000 than $290,000.

Return is important, but so is risk, especially as one gets closer to retirement and has to “eat” their portfolio.

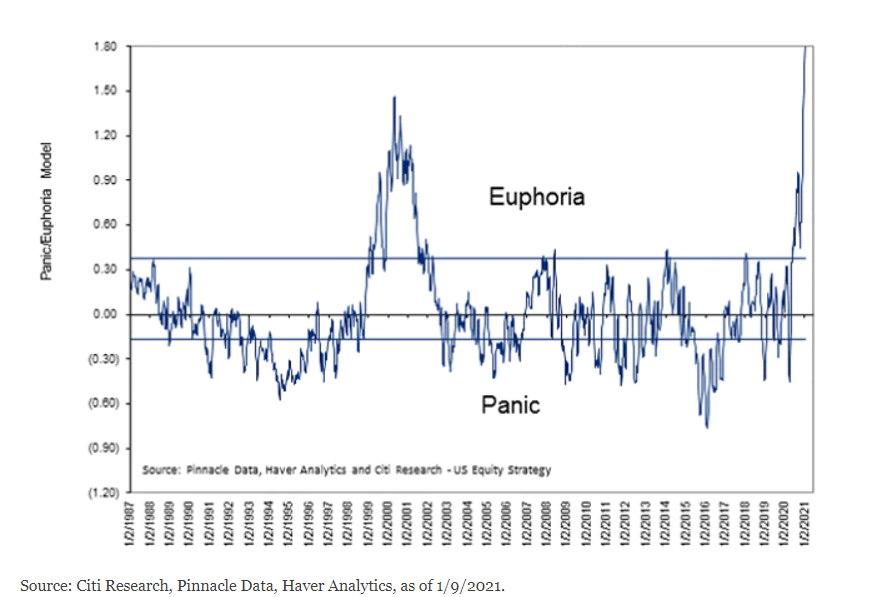
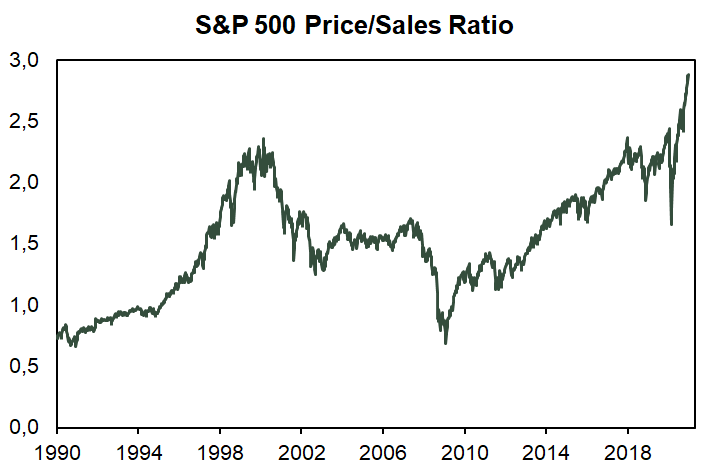
Valuations and investor euphoria are at present elevated, with euphoria at an all time high as well as the price to sales ratio.

Counter that with massive Federal Reserve liquidity shown in the above graph and additional stimulus from Congress and Treasury, and it is anyone’s guess where markets go in the short to intermediate term.  Hence, diversify.  As Gene Fama has said, “During the financial crisis, some investors discovered that their tolerance for risk is lower than they thought, so it might make sense for them to permanently reduce their exposure to equities (stocks)….If the current high volatility makes you permanently averse to stock market volatility, and the inevitable variation in market volatility, you should get out. But you shouldn’t have been in the stock market in the first place since fluctuations in volatility are the norm.”

We are not brokers, and we do not speculate for our clients.  We are investment advisers that take a long-term approach to wealth management and preservation.  We are not averse to clients speculating with a small amounts of money; we just advise against doing so with “stay independent” money.  As the late Nobel Prize winner Merton Miller said, “I choose a few stocks myself.  But I do it strictly for entertainment.”

We are here to evaluate the probabilities, preserve capital for retirement, and grow portfolios prudently based upon the time horizon, needs and risk tolerance of our investors.  We will always take risk and uncertainty into our decision making for our clients, and try to align those considerations with financial plans.  Risk of ruin is always real, and it is something we contemplate for our clients.  As Peter Bernstein and Aswath Damodaran wrote in their book Investment Management, “Staying rich requires an entirely different approach from getting rich.  It might be said that one gets rich by working hard and taking big risks, and that one stays rich by limiting risk and not spending too much.”  We prefer not to grab the cat by the tail.

All the best,

Mike and Emily

PS.   For additional reading regarding both upside and downside risk, please see the following links.  Again, no one knows.

Goldman Sachs says the S&P 500 will rise 14% in 2021
Baupost’s Seth Klarman compares investors to ‘frogs in boiling water’
Grantham Warns of Biden Stimulus Further Inflating Epic Bubble

*The Global 60/40 Fund Custom Benchmark is an unmanaged hypothetical index composed of 60% MSCI World Index (net dividends) and 40% FTSE World Government Bond Index 1-3 Years (hedged). MSCI data copyright MSCI 2021, all rights reserved. FTSE fixed income indices © 2021 FTSE Fixed Income LLC. All rights reserved.  The Nasdaq Composite Index is the market capitalization-weighted index of over 2,500 common equities listed on the Nasdaq stock exchange. All rights reserved.

December 2020 Newsletter

December 11, 2020

“Our linear minds do not like nuances and reduce the information to the binary “harmful” or “helpful.”
Nassim Taleb

“But to say the record of their transactions, the price chart, can be described by random processes is not to say the chart is irrational or haphazard; rather, it is to say it is unpredictable.”
Benoit Mandelbrot

“The returns from equity investing are quite risky. As a result, if the high average stock return of the past is the true long-term expected return, the high volatility of stock returns nevertheless means that getting a positive equity premium (of any size) is highly likely only for holding periods of 35 years (an investment lifetime) or more.”
Gene Fama

I want to give a gentle reminder that risk is always ever present in the financial markets (and in life itself).  I have received many comments recently that investors want to get back “all in” because the markets are making a run.  I am not against that if one understands the risks associated with that position.  There is no free lunch.

Risk can be defined in different ways.  One way in the investing world is called “standard deviation,” which is a fancy way of saying how much returns vary around the average over a given period.

Risk of ruin or major capital loss at the wrong time is another way to view risk.  If one retires and loses half the value of their portfolio, which happened between late 2007 and early 2009 if one were invested 100% in US stocks, one’s retirement could be truly ruined.  Having to withdraw from that nest egg after it was cut in half could pose real long-term financial independence problems.  In financial planning terms, this is called “sequencing” risk, which is having a major loss at the same time you need to draw from your portfolio.

As famed mathematician and investor Ed Thorp wrote in his autobiography, “understanding and dealing correctly with the trade-off between risk and return is a fundamental, but poorly understood, challenge faced by all gamblers and investors…People mostly don’t understand risk, reward and uncertainty.”

Thorp continues:

“Academic finance, as has been recently shown by Ole Peters and Murray Gell-Mann, did not get the point that avoiding ruin, as a general principle, makes your gambling and investment strategy extremely different from the one that is proposed by the academic literature.”

Why is risk so hard to understand in financial markets?  One reason is people assume there are simple, linear, straight line explanations for market movements, which is untrue.  Markets are complex systems, where the total is greater than the sum of its parts.  In other words, the collective behavior of their parts entails the emergence of properties that can hardly, if not at all, be inferred from the properties of the parts.  Ed Thorp says that “people tend to make the error of seeing patterns or explanations when there aren’t any, as we’ve seen from the history of gambling systems.”

Therefore, it is very hard to predict the impact of any one thing on a complex system.  There is much uncertainty.  For example, when governments and other quasi-governmental institutions like the Federal Reserve participate in unfamiliar ways in markets, such as huge monetary stimulus and bond buying that occurred in March and April and continues today, an argument can be made that normal market forces are being impacted by “non-market” players.

Some people do not think Federal Government intervention has much impact, although others are not so sure.  Joe Norman, PhD, and principal of Applied Complexity Science, LLC and a complexity science expert, states that “money and prices are information, that when you add to supply you may ‘patch’ some shortfall in the near term, but also dilute information that is conveyed in transactions and prices.  One may eventually cross a threshold where there’s not enough information for the system to hang together.”

Accurate prices are important for the correct allocation of resources.  Manipulation of prices, whether by anti-competitive behavior of private market participants or government manipulation through abnormal Federal Reserve practices, can distort prices and information that would be contained in otherwise “market” prices.

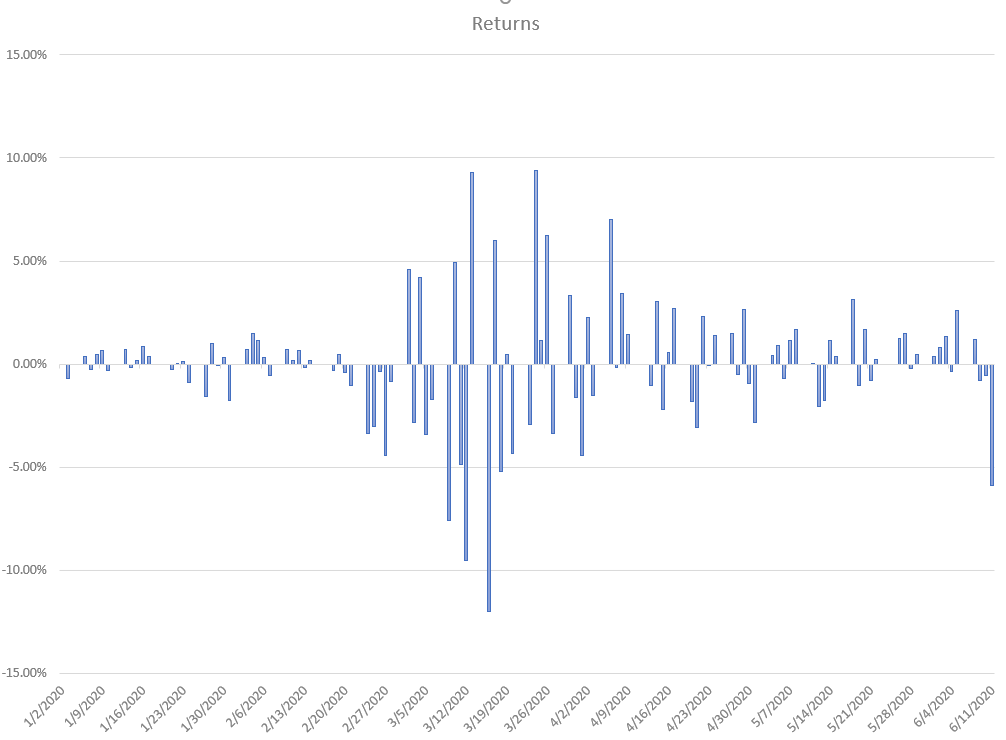
Changes in market prices can occur very quickly and in large magnitude, just like this February and March.  These are called “fat tail” events, and they occur more frequently than you would expect based upon on normal statistics.  Nassim Taleb defines a fat tail as an “extreme event at a low frequency.”

Gene Fama wrote about fat tails in his dissertation in 1964.

“Half of my 1964 Ph.D. thesis is tests of market efficiency, and the other half is a detailed examination of the distribution of stock returns. Mandelbrot is right. The distribution is fat-tailed relative to the normal distribution. In other words, extreme returns occur much more often than would be expected if returns were normal.”

Benoit Mandelbrot goes on to say about markets that “the market is very risky—far more risky than if you blithely assume that prices meander around a polite Gaussian (normal distribution) average.” He states that the capacity for large “jumps, or discontinuity, is the principal conceptual difference between economics and classical physics.”  He analogized that big floods “were like big price jumps; the disastrous droughts were market crashes.”  And Nassim Taleb states that “financial matters – and other economic matters – tend to be from Extremistan, just like history, which moves by discontinuities and jumps from one state to another.”

As Mandelbrot continues:

“Unlike a broker, most investors do not care about ‘average’ returns.  For them, the rare, out-of-average catastrophes loom larger… The ultimate fear is financial ruin.”

What risks exist in the marketplace today? Some are known, and many are unknown.  Below are some risks:

  1. Domestic Political Risk
  2. Market or Pricing Risk
  3. Macroeconomic risk, such as unemployment, demand, etc.
  4. Default Risk of outstanding debt, both corporate, muni and other government debt
  5. Interest Rate Risk, related to the above
  6. Inflation Risk
  7. Proper functioning of treasury/credit markets, which stopped functioning normally in March
  8. Climate/Natural environment risk (hurricanes, flooding, etc.)
  9. Geopolitical Risk, including war
  10. Free trade risk
  11. Regarding the pandemic, vaccine, and shutdown risks

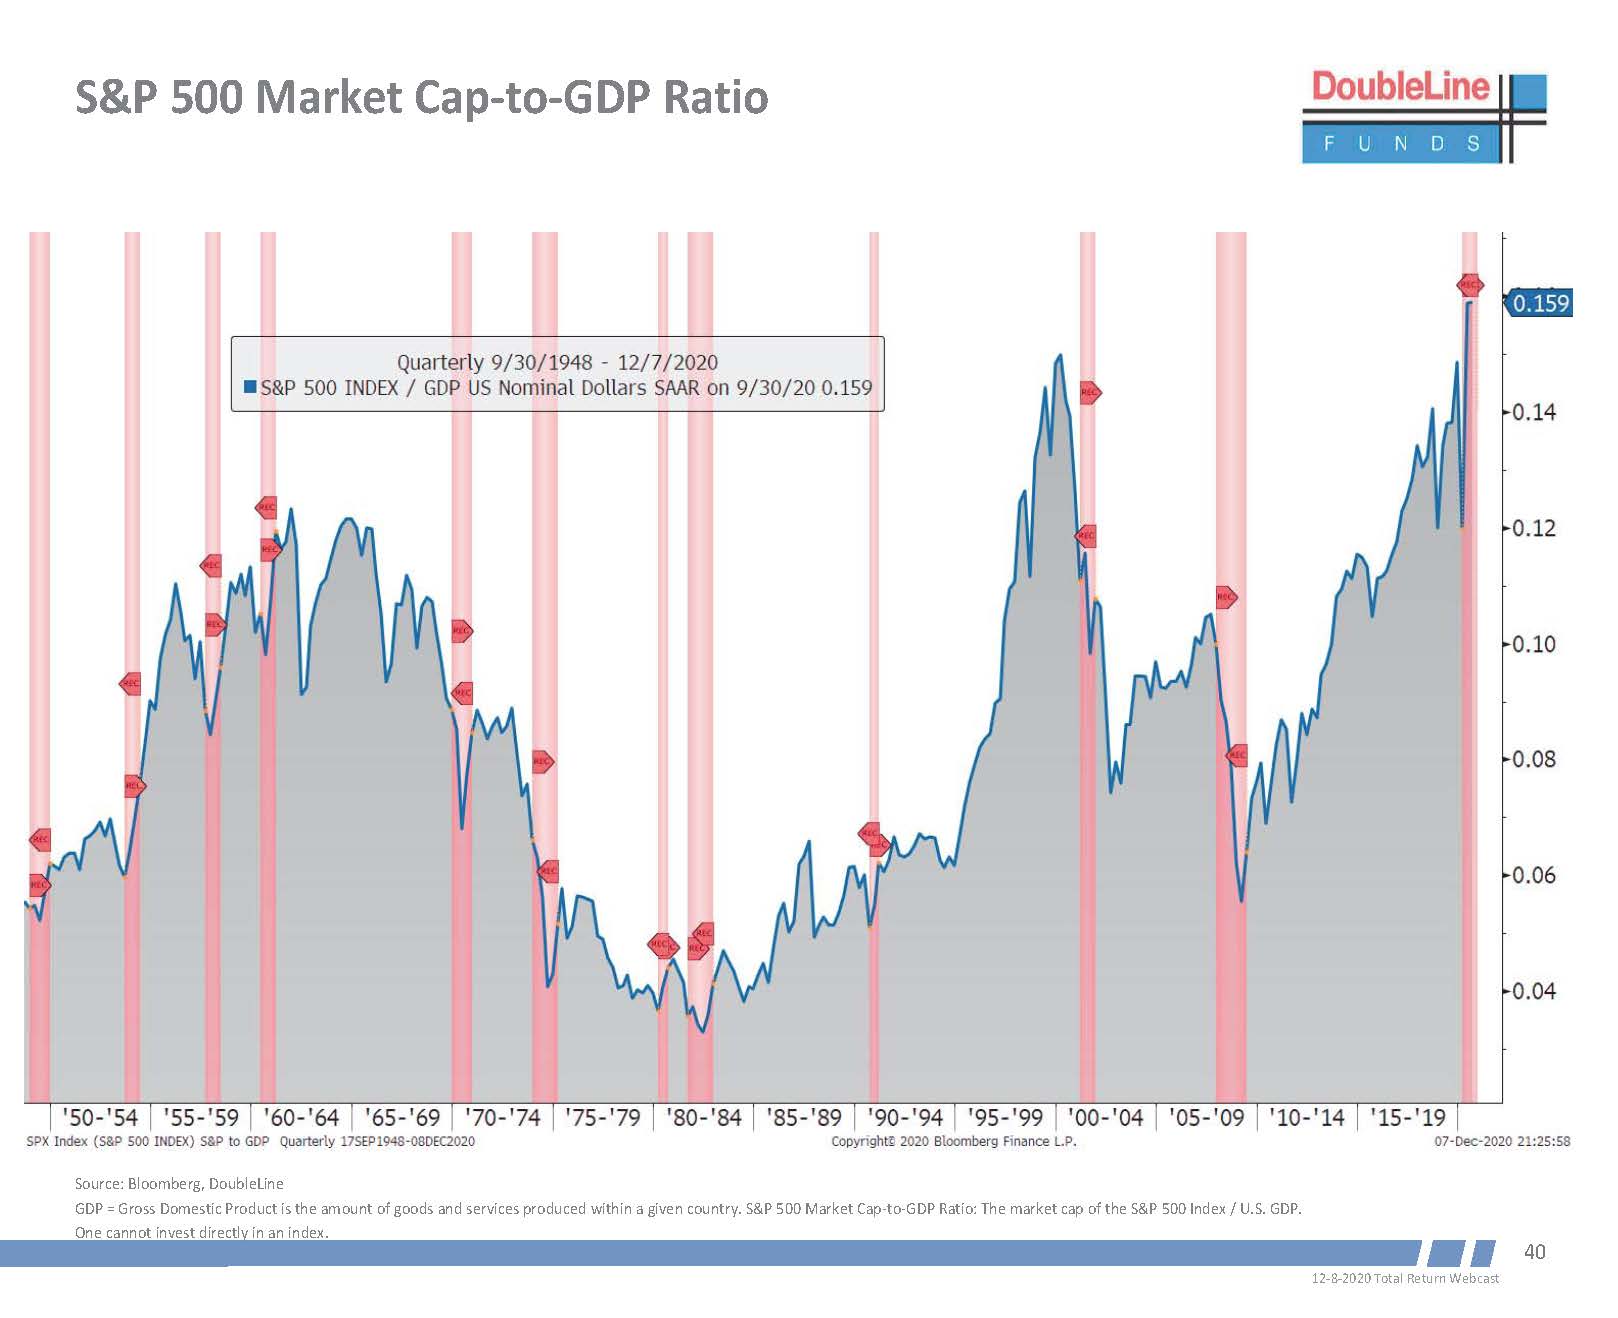
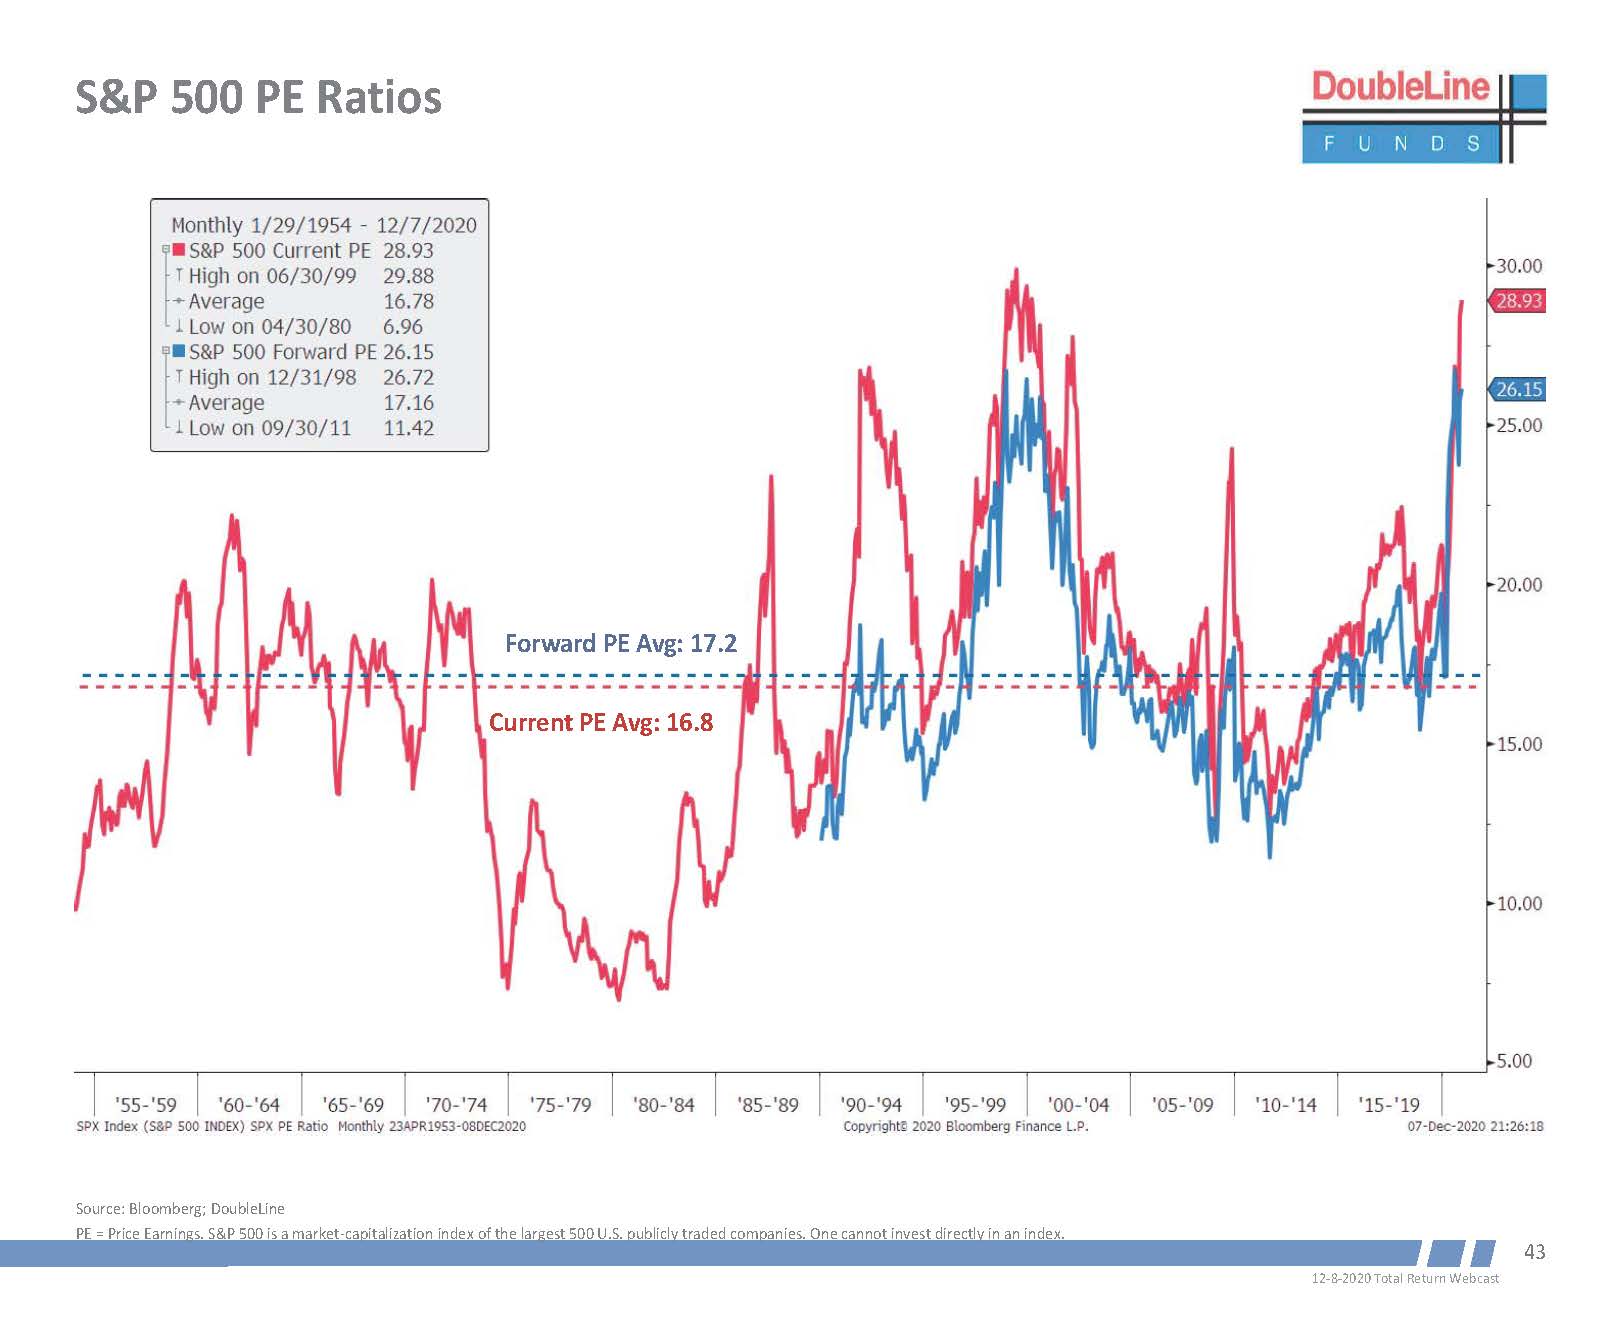
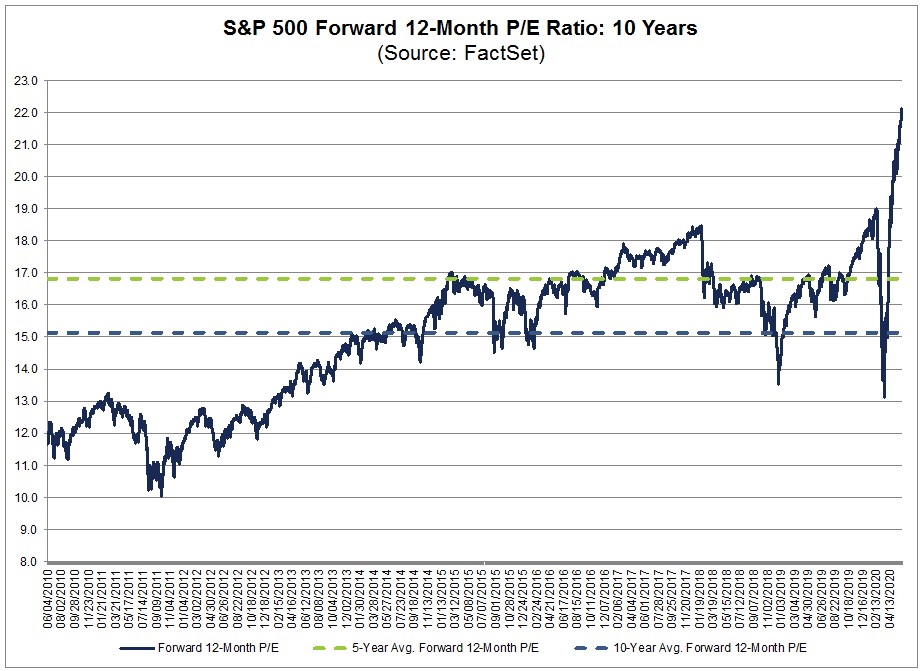
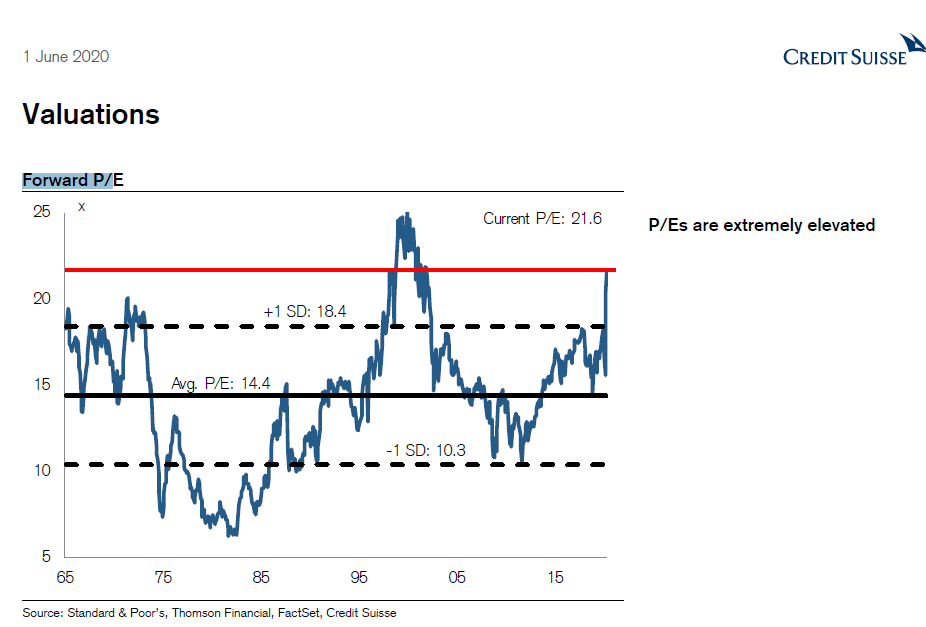
Expected returns in the markets are always positive, but they vary over time.  Since markets are at high valuations, as shown by the graphs below, expected returns are lower than when the market is at lower valuations.  One needs to consider their time horizon and cash needs when deciding on how much risk to take.

One can see that the market value is at an elevated level both as compared to the Gross Domestic Product of the United States (which is a favorite valuation metric of Warren Buffett) and compared to earnings.

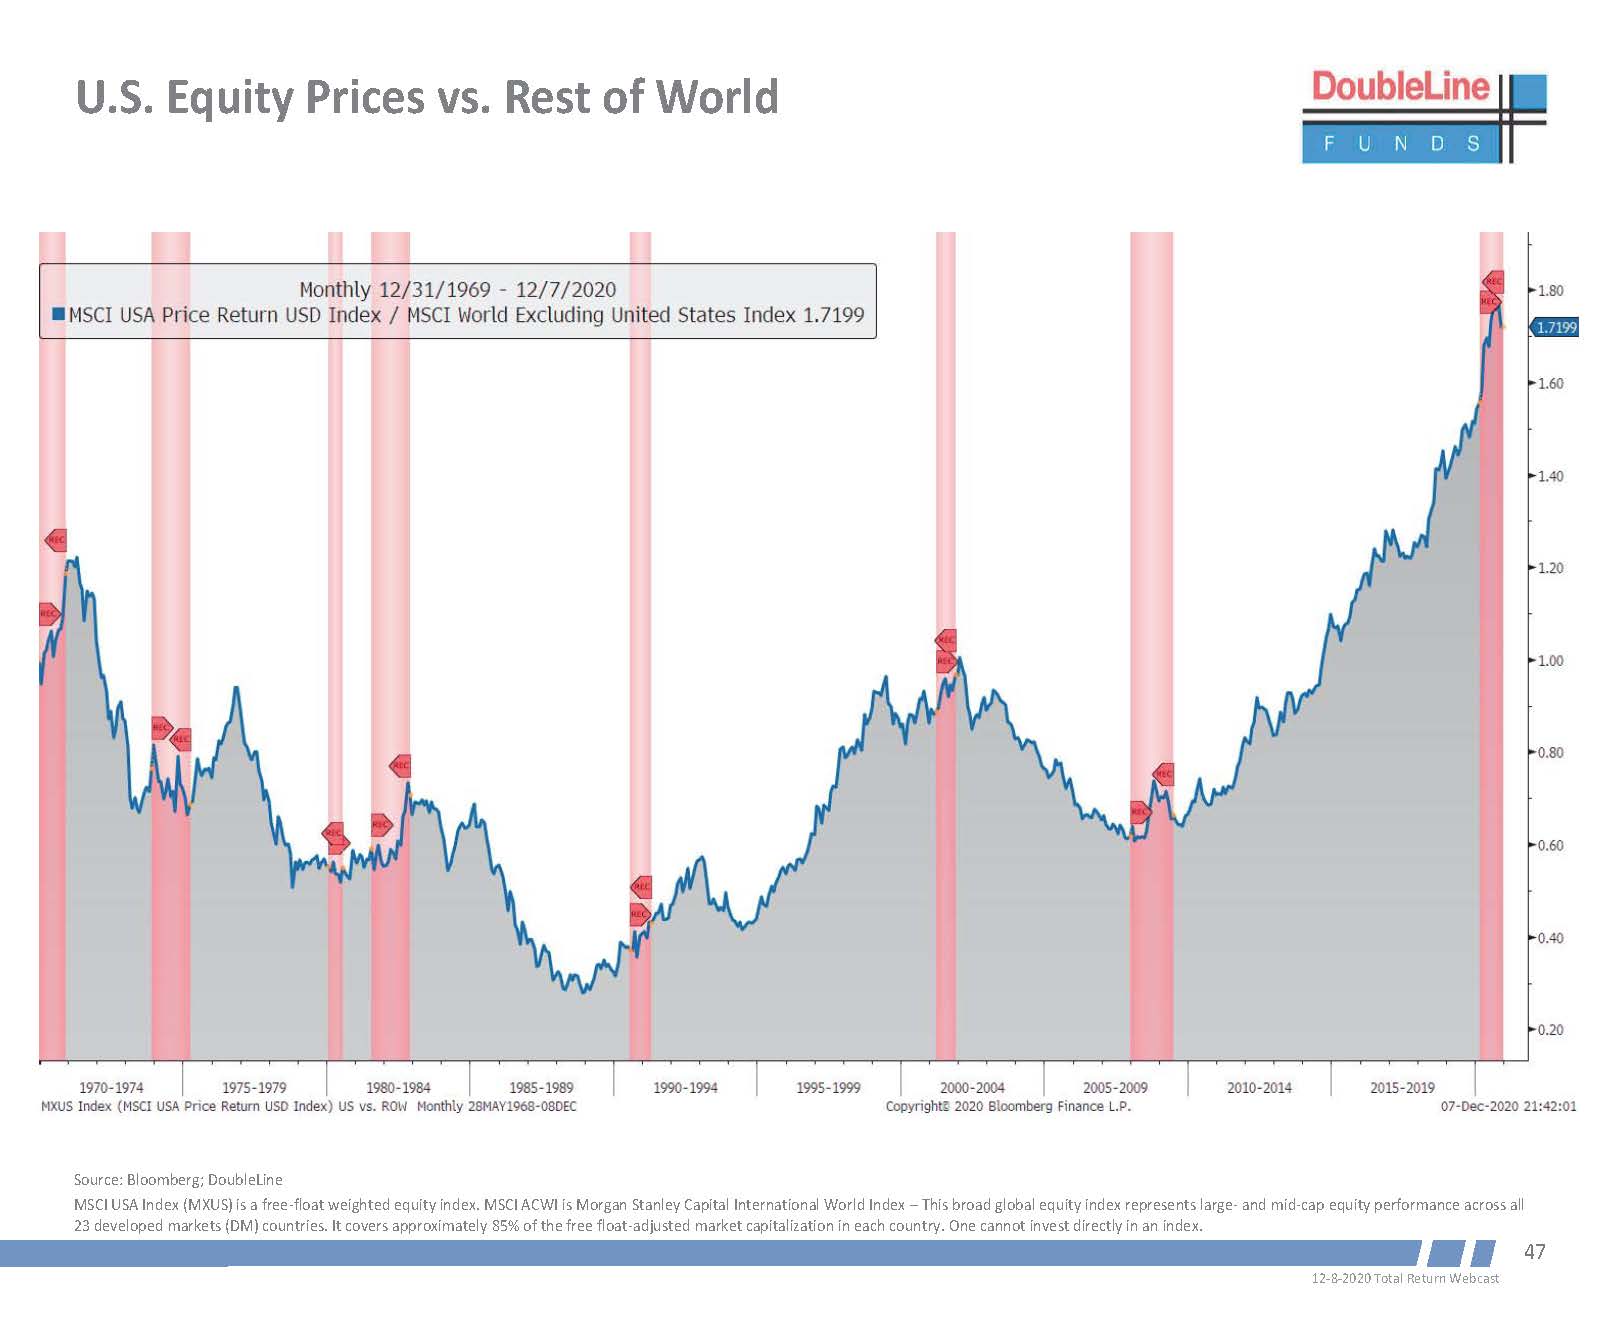
As you can see below, US stocks are priced high compared to international stocks.

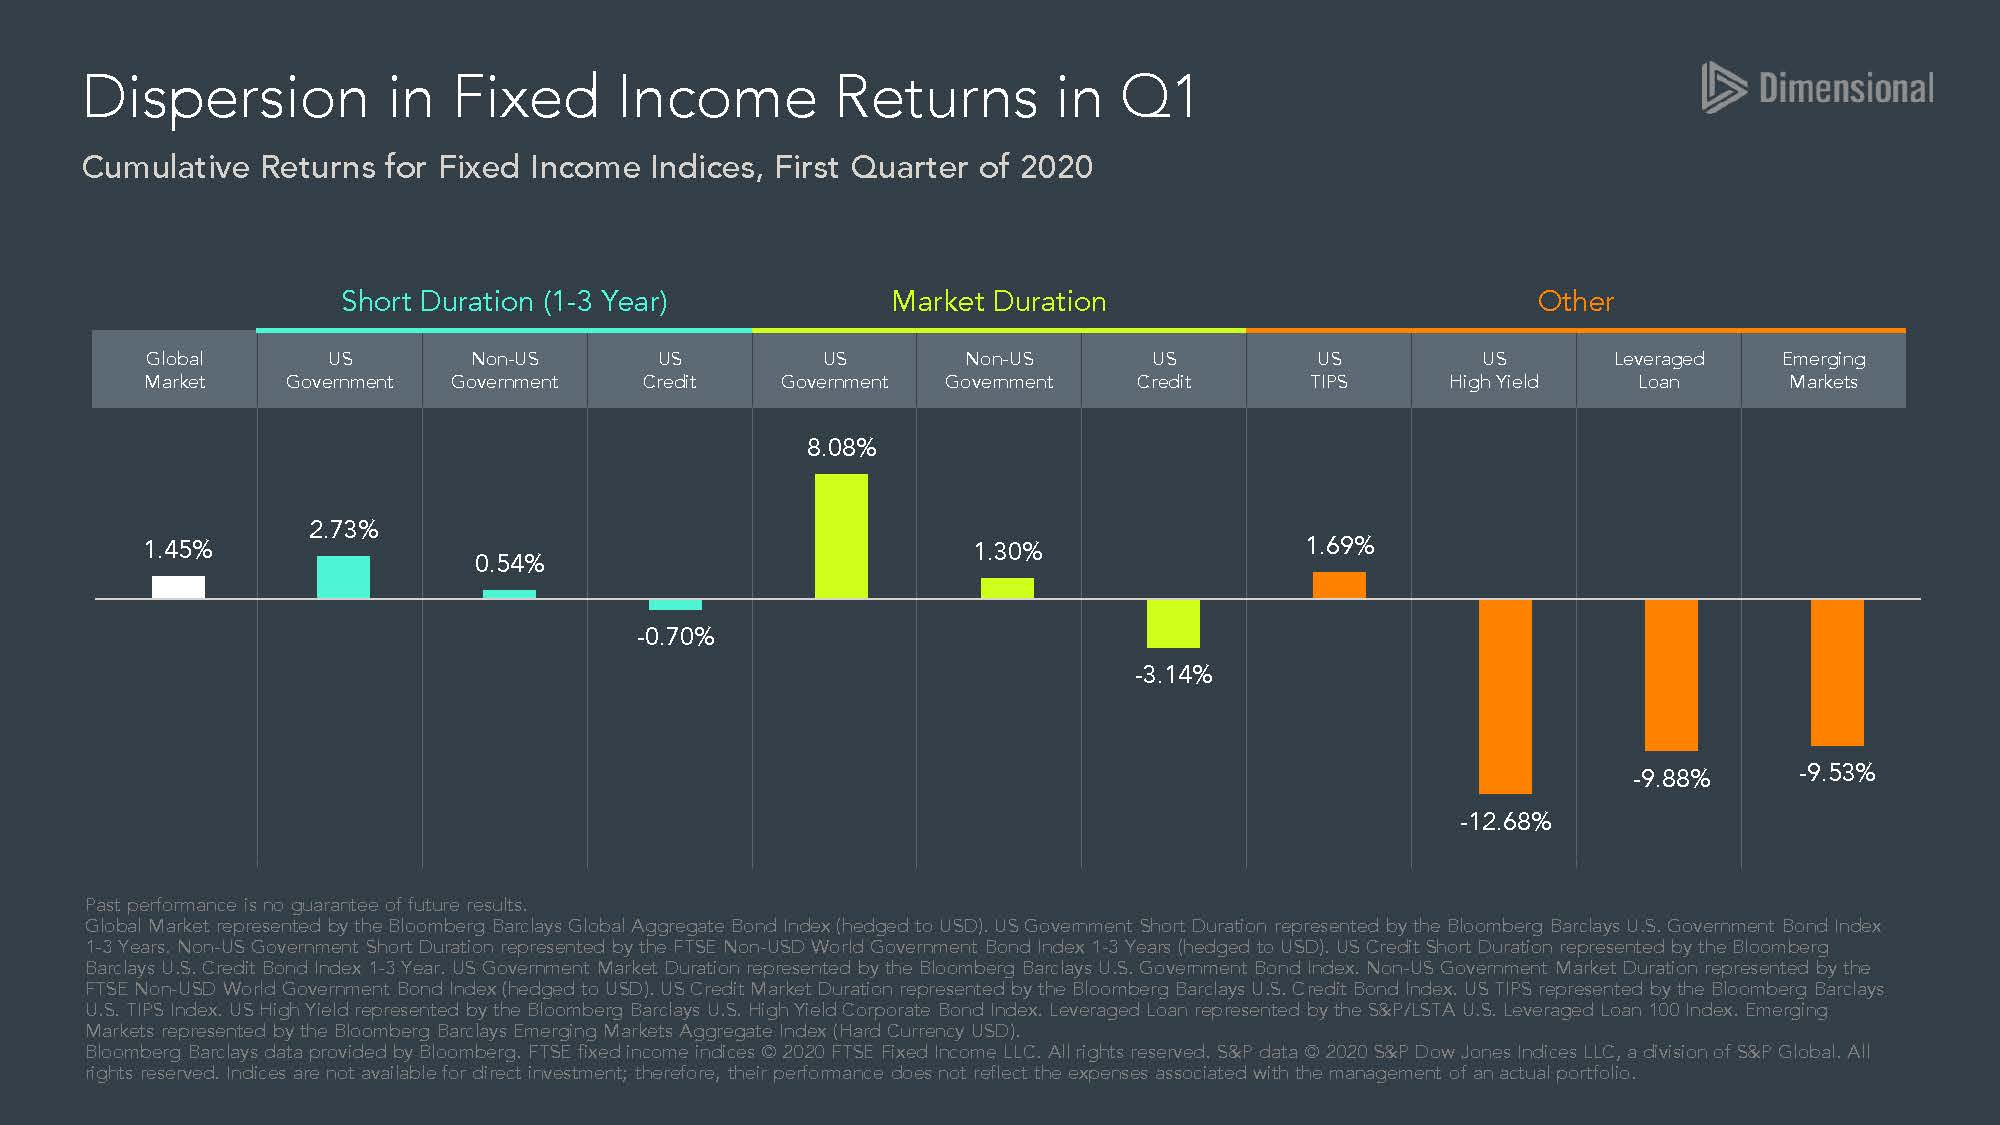
How does one protect against risk? The most important is to diversify across asset classes.  Besides diversifying in stocks around the world and other “factors,” we believe shorter to intermediate bonds, including short-term US government debt, protects portfolios when uncertainty increases.  Please look at the chart below on how different bond classes performed in February and March when stocks tanked.  As you can see, US Government bonds did very well in an uncertain environment.  High yield/junk did not, because that is risky debt, and that acts more like stocks.

There are other “tail” risk hedges that might make sense.  We are reviewing a new low-cost ETF that we may implement into the portfolios that could provide some diversification that “insures” against risk by buying deep out of the money puts. Research shows that if implemented correctly, risk protection kicks in.  Other things to focus on are low fees and expenses, and not trying to time the markets.

Passive investing is also a wise strategy.  As Nobel prize winner Danny Kahneman wrote in Thinking Fast and Slow:

“The evidence from more than fifty years of research is conclusive: for a large majority of fund managers, the selection of stocks is more like rolling dice than like playing poker. Typically, at least two out of every three mutual funds underperform the overall market in any given year.”

And remember, those mutual fund managers are professional investors.  The stats get worse over longer period of times.  For example, 77.97% of Large Cap funds underperformed the S&P 500 over the past 5 years.  See SPIVA (spindices.com).

Risk is always with us. As Mandelbrot found, “at short time frames prices vary wildly, and at longer time frames they start to settle down.” It is important to consider risk when investing. We are here to help you think through those issues when putting together your portfolio.

All the best,

Mike and Emily

P.S.   I have been drafting this for several weeks.  However, I dedicate this to my brother Jim, who passed away on Monday.  Unfortunately, he was not able to overcome the risk of kidney disease.  We will remember his kindness and smile throughout the holiday season and beyond.  Rest in peace brother.

October 2020 Newsletter

October 12, 2020

“The high volatility of stock returns is common knowledge, but many professional investors seem unaware of its implications. Negative [stock] equity premiums and negative premiums of value and small stock returns relative to market are commonplace for three- to five-year periods, and they are far from rare for ten-year periods. Given this uncertainty, investors who will abandon equities or tilts toward value or small stocks in the face of three, five, or even ten years of disappointing returns may be wise to avoid these strategies in the first place.”
Eugene Fama and Kenneth French
Volatility Lessons

“For many years, scholars and investment professionals have argued that value strategies outperform the market. These value strategies call for buying stocks that have low prices relative to earnings, dividends, book assets, or other measures of fundamental value. While there is some agreement that value strategies produce higher returns, the interpretation of why they do so is more controversial. This article provides evidence that value strategies yield higher returns because these strategies exploit the suboptimal behavior of the typical investor and not because these strategies are fundamentally riskier.”
Josef Lakonishok Andrei Shleifer Robert W. Vishny
Contrarian Investment, Extrapolation, and Risk

“I don’t believe all the nonsense about market timing. Just buy very good value and when the market is ready that value will be recognized.”
Henry Singleton
Former Chairman of Teledyne

“Price is what you pay; value is what you get.”
Warren Buffett


It has been a unique year, that is for sure. Below are the indices we track.


Data Series (As of 9/30/2020) QTD YTD 1 Year 3 Years 5 Years 10 Years
S&P 500 8.93% 5.57% 15.15% 12.28% 14.15% 13.74%
Russell 2000 4.93% -8.69% 0.39% 1.77% 8.00% 9.85%
Russell 2000 Value 2.56% -21.54% -14.88% -5.13% 4.11% 7.09%
MSCI World ex USA (net div.) 4.92% -7.13% 0.16% 0.62% 5.32% 4.37%
MSCI World ex USA Small Cap (net div.) 10.12% -4.05% 6.88% 1.42% 7.35% 6.55%
MSCI Emerging Markets (net div.) 9.56% -1.16% 10.54% 2.42% 8.97% 2.50%
Bloomberg Barclays U.S. Treasury Bond 1-5 Years 0.13% 4.37% 4.72% 3.23% 2.21% 1.72%
ICE BofA 1-Year US Treasury Note 0.08% 1.77% 2.37% 2.19% 1.54% 0.93%


Lately there has been an increased focus on the S&P 500 and its outperformance. Most people “track” to that index, although that is only one asset class, which is large capitalization US stocks. While it is widely agreed upon that the S&P 500 is an adequate representation of the US large cap market, it still represents less than half of the total global market value. We take a more diversified approach.

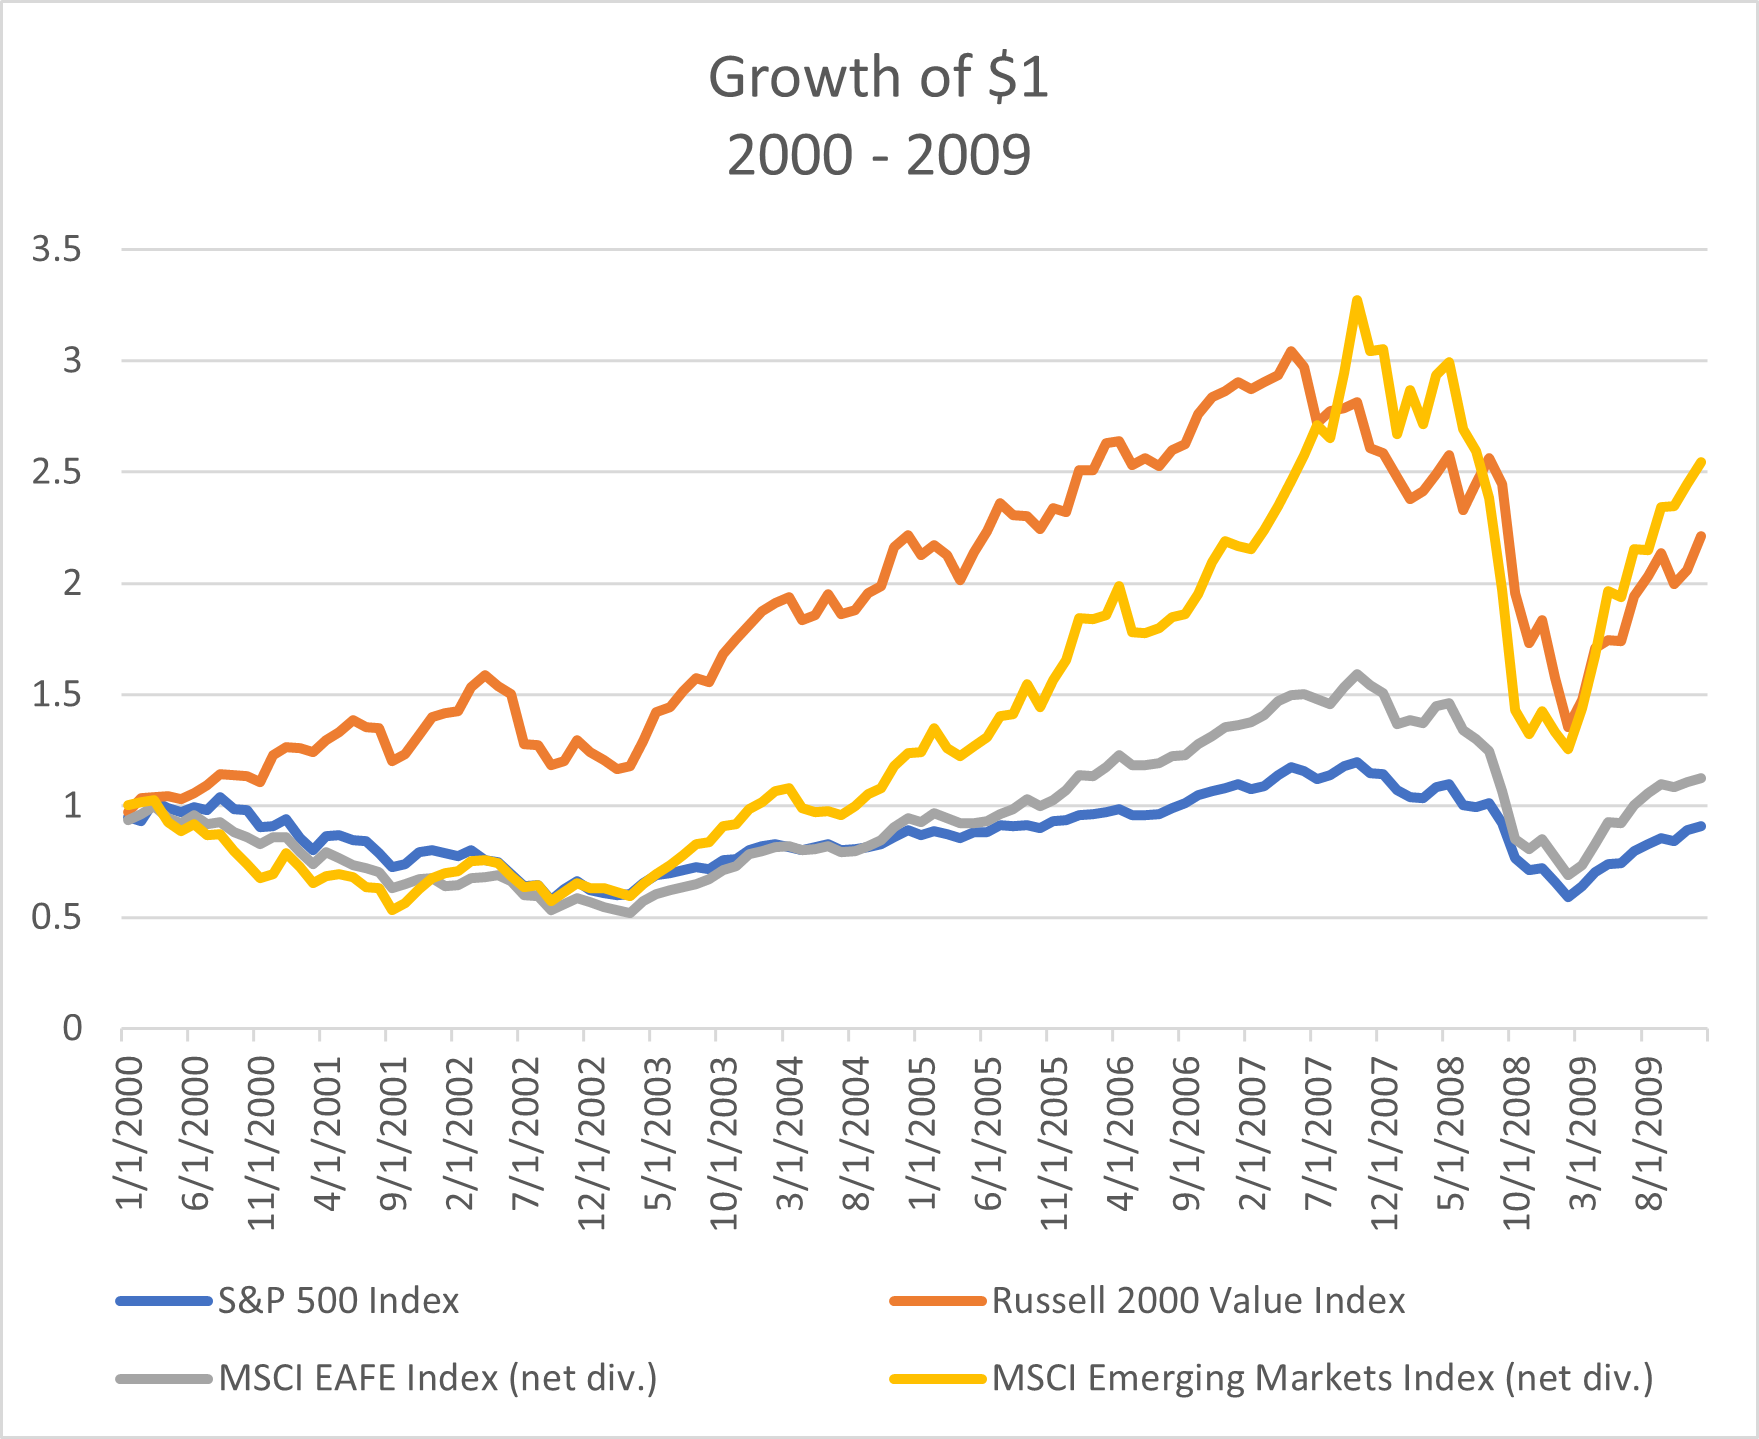
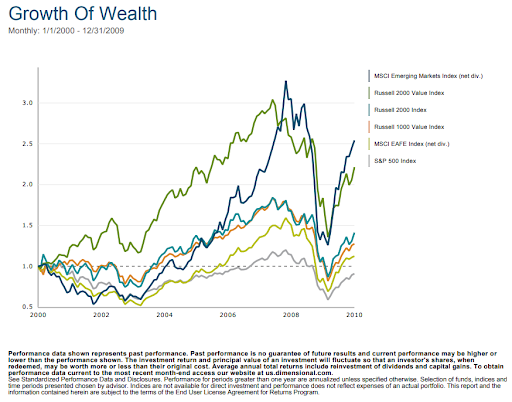
What people quickly forget is the S&P 500 was negative for the entire decade of 2000-2009. It was international, emerging markets, and value that carried the portfolios during that decade. See chart and graph below.


Data Series 10 Years (Jan 2000 – December 2009)
S&P 500 -0.95%
Russell 1000 Value (Large Value) 2.47%
Russell 2000 (Small) 3.51%
Russell 2000 Value (Small Value) 8.27%
MSCI EAFE (net div.) (Int’l) 1.17%
MSCI Emerging Markets (net div.) 9.78%

Here is the growth of a dollar from 2000-2009 for each of the above indices.


As you can see from the first data series above showing current returns, both small (Russell 2000) and value (Russell 2000 Value) have suffered recently, especially over the past 3 years. A question that keeps getting repeatedly asked is “is value dead?”

We don’t believe so, and after our discussions with fund providers that track value, neither does Dimensional Fund Advisors, AQR, Avantis or BlackRock.

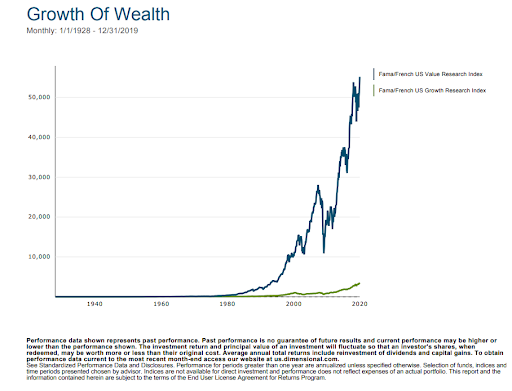
How does one define value versus growth? We define value by taking a quantitative approach using certain financial ratios, such as low price/book value, low price/earnings, low price/cash flow, etc. We normally define value as the top 30% of the total market that meets the sorting criteria above (growth would be the bottom 30% of the same criteria). All else being equal, one is buying more earnings, cash flow or value for a given stock price, book value or market capitalization. As measured by our current preferred ratio, book value/market value, value has beaten growth over the long-haul.

Based upon the difference between Fama/French Value versus Growth Indices since 1928, Value has beaten Growth by approximately 3.31% annualized. That is a pretty big difference. If one could invest in an index (one cannot, and disclaimer is below), a dollar would have grown into the following for each of the Fama/French Indices since 1928 through the end of 2019.

However, this year has been different.  From January through August, the Fama/French Growth Index has beaten the Value Index by an astonishing 46%. What is going on?

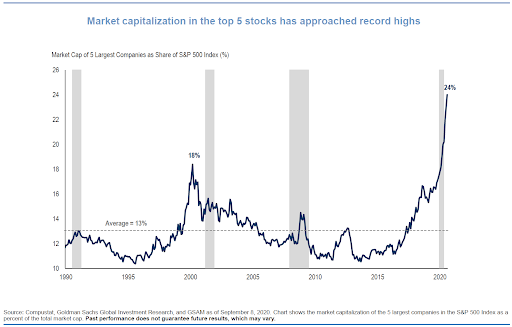
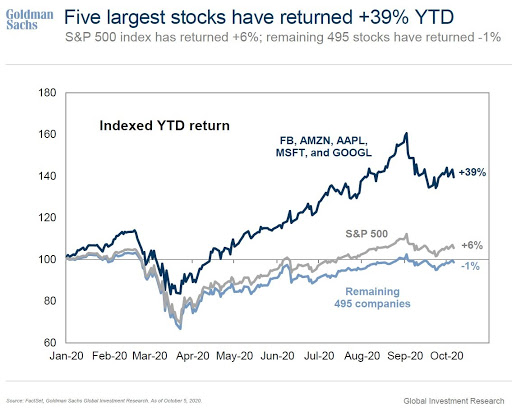
With any complex system with many variables impacting it, it is hard to cite one reason.  However, the top 5 companies (Apple, Microsoft, Amazon, Facebook and Alphabet) of the S&P 500 increased their share of the total value of the S&P 500 to 24% as of September 8, which was near a record, and were at 22.8% as of September 30.

Further, as of October 5, those same stocks were up 39% year to date at that point, while the total index was up 6%, and the bottom 495 stocks in the S&P 500 were down 1%.

Part of the reason is most likely that work from home due to Covid caused a re-alignment of technology needs for corporations and businesses in general.  Large companies (and small for that matter) had to increase their bandwidth, cybersecurity, VPN abilities, software licenses (office software) and cloud storage.  Demand for the top 5 companies’ services increased greatly.  An increased volume of business plus pricing power was great for sales and profits, and share prices were bid up as a consequence, leading to unexpected returns.

Variance of returns in any given year or time period around the average is large for both value and growth.  Therefore, it is not uncommon for growth to outperform in any given year; it was the magnitude of the outperformance in 2020 that has been a bit eye popping.

What are the expected returns of those “growth” stocks going forward versus value stocks that have not had those same recent results?

We would argue that the expected return is greater for value stocks going forward versus growth, especially for the top 5 mentioned.  As Professor Ken French recently wrote:

“Investment returns have two parts: the expected return and the unexpected return. The expected return is the best guess of what will happen based on all the information currently available. The unexpected return is the surprise, the difference between what does happen and what was expected. Investors should base their portfolio decisions on expected future returns, not recent realized returns, and the two can differ by a lot.”

“Given their great returns over the last 10 years, what is our best guess of how the FAANG stocks will do over the next decade? Should we expect an average annual return of almost 35% again? Absolutely not. Who wouldn’t buy these stocks if their expected returns were 35%? But buyers need sellers. The demand driven by such high expected returns would simply push prices up and drive expected returns down to a more reasonable level. For the same reason, I’m confident that if we could go back to August 2010, we would find few investors predicting the FAANG stocks would do as well as they did from 2010 to 2020.”

While there’s no way to know where stocks are going next, value has trailed growth numerous times in the past before rebounding strongly.  A case in point was immediately before and after the tech bubble burst in 2000.  Value was in the doldrums prior to 2000.  However, value rebounded sharply and outperformed growth by over 18% annualized from January 2000 – December 2003.  One never knows when the premium is going to surface, but if you are not exposed to it, you will not benefit from it either.

Finally, several years of returns tells one absolutely nothing about the skill of any money manager.  As Ken French explains:

“It takes about 35 years of returns to say with any statistical confidence that stocks have a higher expected return than the risk-free rate [that means treasury bills]. Think about a hedge fund that has equity-like volatility. If the manager’s alpha was as large as the market risk premium — which would be huge — it would also take about 35 years to be confident the manager has any value added — and that’s before his fees of “2 and 20.” Even if that phenomenal manager is out there, is he likely to stick around long enough for us to be able to figure out he wasn’t just lucky?”

In other words, it takes a very long time to determine whether an asset manager has any skill to beat the market.  Who is around that long?  Basing investment decisions on returns over short periods of time is a mistake, as wide variance around the average tells one nothing about long-term returns.

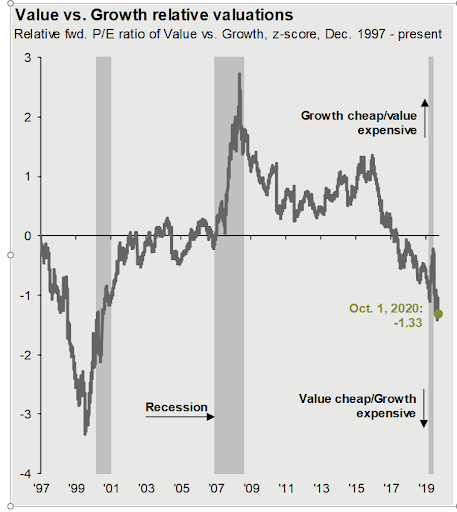
Value has not been this cheap compared to growth since 2000/2001.  We believe it makes sense to continue to capture some of that in the long-term, while also practicing broad diversification.  As our friends at Avantis have written:

“While we can’t know what the future will bring, we can say that now, more than any time in recent history, investors in growth stocks are baking in very high expectations of future earnings growth (that may or may not materialize) or extremely low expected returns.”

Source: FactSet, FTSE Russell, NBER, J.P. Morgan Asset Management. Growth is represented by the Russell 1000 Growth Index and Value is represented by the Russell 1000 Value Index. Beta is calculated relative to the Russell 1000 Index. U.S. Data are as of October 1, 2020.

Election

With the upcoming election we are cognizant of client concerns as to what impact this might have on the markets. Reflecting on our message back in 2016, which was a very contentious election, we will again consider data versus ideology, not take sides, and present our message, along with the main messages of other respected investment companies such as Dimensional Fund Advisors, Vanguard, Avantis and Goldman Sachs, no matter what side of the aisle you sit.

  1. Stock Market Volatility sometimes spikes a bit in presidential election years most likely due to uncertainty, but typically stops increasing shortly after the election is over.
  2. According to Vanguard research, stock market returns are virtually identical no matter which party controls the White House.
  3. Presidential elections have had little impact on bond markets as well.
  4. There is a strong case for investors to rely on patience and portfolio structure, rather than trying to outguess the market, in order to pursue investment returns.
  5. Many factors influence market behavior other than the party in office, including market valuations, globalization, technology, demographics, the Federal Reserve, the economy, and unforeseen events such as wars and natural disasters.
  6. The efficiency of the markets means expectations at any point in time are already reflected in market prices.
  7. The new President’s economic policies may not be fully enacted due to Congressional involvement, and no one knows how such policies will influence the marke

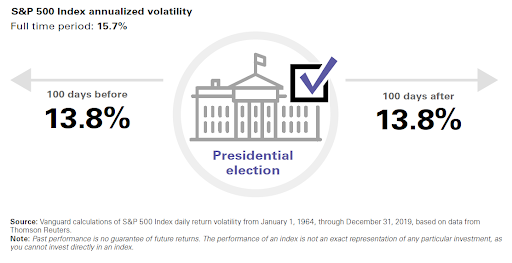
As the upcoming election has caused an increase in uncertainty as to the political parties who will be in power of the respective branches of our government, there is a chance for continued market volatility to be realized on top of the ongoing pandemic. However, a great piece published by Vanguard this week shows that historically markets actually tend to ignore the election relative to volatility. From January 1, 1964, to December 31, 2019, the Standard & Poor’s 500 Index’s annualized volatility was 13.8% in the 100 days both before and after a presidential election, which was lower than the 15.7% annualized volatility for the full time period.

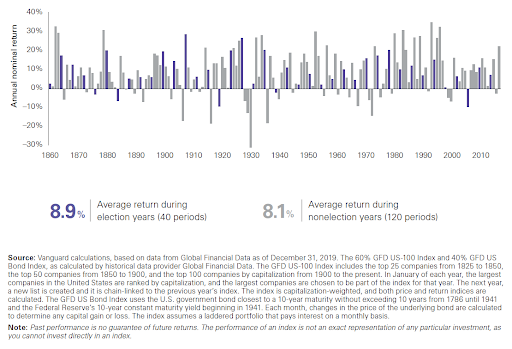
Further, Vanguard also shows that comparing election year versus non-election year (in a 60% stock, 40% bond portfolio) returns, there is no statistical difference in returns.

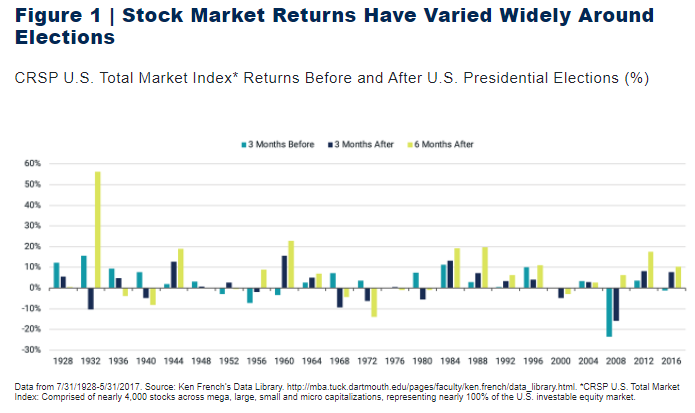
A similar view from Avantis Investors shows that stock market returns have varied widely around elections and there is no statistical significance that can help determine whether a particular party would lead to better stock returns.

Figure 1: Avantis: Stock Market Returns Have Varied Widely Around Elections

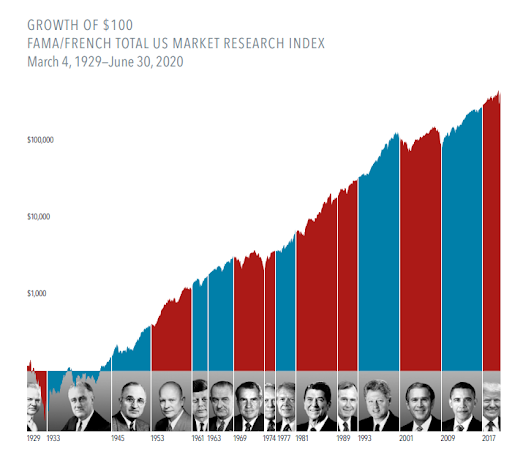
It’s natural for investors to look for a connection between who wins the White House and which way stocks will go. But as nearly a century of returns shows, stocks have trended upward across administrations from both parties.

Shareholders are investing in companies, not a political party. And companies focus on serving their customers and growing their businesses, regardless of who is in the White House.

US presidents may have an impact on market returns, but so do hundreds, if not thousands, of other factors—the actions of foreign leaders, a global pandemic, interest rate changes, rising and falling oil prices, and technological advances, just to name a few.

You can view an interactive version of this chart highlighting more details within each presidency and the impacts on markets here.

In the end, markets have rewarded disciplined, long-term investors, regardless of which party is in office. We believe it is important to remain diversified and focus on your long term goals and financial plan.

We hope you remain safe and healthy in this uncertain time.

Until next time,

Mike and Emily


DISCLOSURES

Past performance is no guarantee of future results. International investing involves special risks such as currency fluctuation and political instability.

Growth stocks are stocks trading at a high price relative to a measure of fundamental value such as book equity. Value stocks are stocks trading at a low price relative to a measure of fundamental value such as book equity. Value premium is the return difference between stocks with low relative prices (value) and stocks with high relative prices (growth).

The information in this document is provided in good faith without any warranty and is intended for the recipient’s background information only. It does not constitute investment advice, a recommendation, or an offer of any services or products for sale and is not intended to provide a sufficient basis on which to make an investment decision. It is the responsibility of any persons wishing to make a purchase to inform themselves of and observe all applicable laws and regulations. Unauthorized copying, reproducing, duplicating, or transmitting of this document are strictly prohibited.

Investments involve risks. The investment return and principal value of an investment may fluctuate so that an investor’s shares, when redeemed, may be worth more or less than their original value. Past performance is not a guarantee of future results. There is no guarantee strategies will be successful.

The Fama/French Indices reflected above are not “financial indices” for the purpose of the EU Markets in Financial Instruments Directive (MiFID). Rather, they represent academic concepts that may be relevant or informative about portfolio construction and are not available for direct investment or for use as a benchmark. Their performance does not reflect the expenses associated with the management of an actual portfolio. Index returns are not representative of actual portfolios and do not reflect costs and fees associated with an actual investment. Actual returns may be lower.

July 2020 Newsletter

July 20, 2020

“Like solo sailors venturing into the Southern Ocean, climbers are seduced by risk. The desire to push to a summit or scale a rock face is so strong that they consciously or subconsciously minimize safety precautions drilled into their brains.”
Charles Duhigg

“It amazes me how people are often more willing to act based on little or no data than to use data that is a challenge to assemble.”
Robert Shiller

“Irrational exuberance is the psychological basis of a speculative bubble. I define a speculative bubble as a situation in which news of price increases spurs investor enthusiasm, which spreads by psychological contagion from person to person, in the process amplifying stories that might justify the price increases and bringing in a larger and larger class of investors, who, despite doubts about the real value of an investment, are drawn to it partly through envy of others’ successes and partly through a gambler’s excitement.”
Robert Shiller, Irrational Exuberance

“Large price changes tend to be followed by more large changes, positive or negative. Small changes tend to be followed by more small changes. Volatility clusters. A fund manager or investor who cannot tolerate the risk of a large loss might, when the financial storm signs are up, simply trim his sails and avoid bold bets.”
Benoit Mandelbrot, The Misbehavior or Markets

The second quarter was a very good one overall for the equity markets. Below are the indices we track.


Data Series (% USD) 3 Months YTD 1 Year 3 Years 5 Years 10 Years
S&P 500 20.54% -3.08% 7.51% 10.73% 10.73% 13.99%
Russell 2000 25.42% 12.98% -6.63% 2.01% 4.29% 10.50%
Russell 2000 Value 18.91% -23.50% -17.48% -4.35% 1.26% 7.82%
MSCI World ex USA 15.34% -11.49% -5.42% 0.84% 2.01% 5.43%
MSCI World ex USA Small Cap 21.66% -12.87% -3.20% 0.53% 3.56% 7.26%
MSCI Emerging Markets 18.08% -9.78% -3.39% 1.90% 2.86% 3.27%
Bloomberg Barclays U.S. T Bond 1-5 Yr 0.40% 4.23% 5.38% 3.28% 2.33% 1.85%
ICE BofA 1-Year US T Note -0.03% 1.69% 2.86% 2.25% 1.54% 0.95%

Obviously, it has been a very wild ride. The first quarter was one of the worst in the history of the US stock markets, and the second quarter was one of the best. Although the quarter was a good one, volatility remains elevated significantly from historical averages, and as long as the coronavirus continues to infect and hospitalize significant amounts of people, it is almost assured that volatility will remain high.

When volatility is high, it does not predict whether stocks will decrease or increase in value, only that the swings either way will be larger than they are normally. However, because of that risk, people in retirement or close to it may want to consider their asset allocation to make sure it is not too aggressive in the event the market has a wild swing to the downside. If such an event would occur, markets may not recover fast enough to protect a portfolio from permanent damage due to the necessity to take withdrawals from the portfolio at the same time it has declined in value. If one needs cash in the next year, it would be wise to free it up now since the markets have recovered nicely.

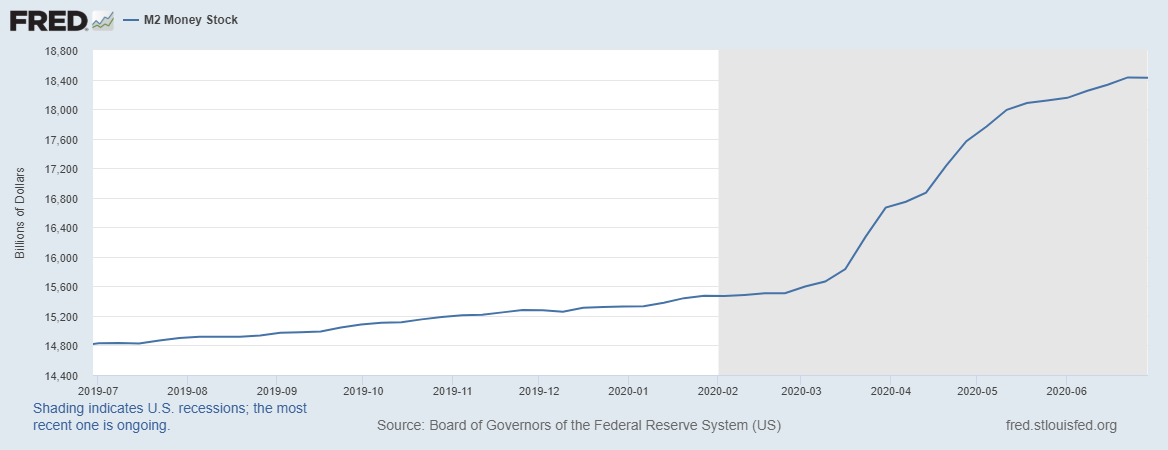
A case can be made for both optimism and pessimism in the short to medium term.. On the positive side, the Federal Reserve has increased Money Supply in historic proportions (see chart below) and Congress has implemented numerous fiscal stimulus programs over the past 4 months, and more are likely, although not guaranteed.

The Federal Reserve has stated:

“So let me say that we’re—we’re committed to using our full range of tools to support the economy in this challenging time. We’re going to use them, as I mentioned, forcefully, proactively, and aggressively until we’re confident that we’re solidly on the road to recovery and also to assure that that recovery, when it comes, will be as robust as possible. As long as needed, we’ll use them. And I would just say, we have a number of dimensions on which we can still provide support to the economy.”

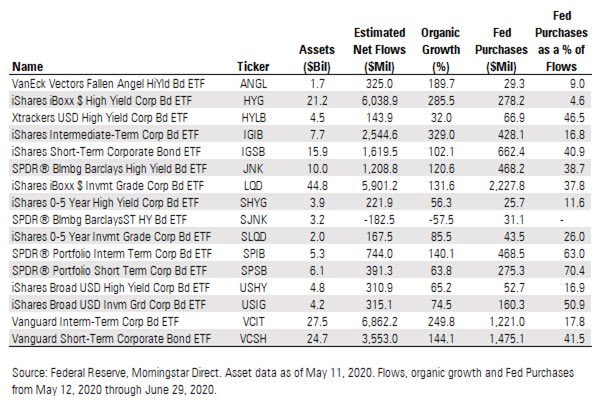
Further, the Fed is a large buyer of Bond ETFs right now. From May 12-June 29, they were responsible for up to 70% of the flows of some of those funds, as shown in the chart below. That supports the prices of the ETFs and lowers the cost of capital, and indirectly supports stock prices also.

In addition, businesses are opening back up, some faster than others.

On the downside, unemployment remains stubbornly high, and if it continues to do so, demand could be negatively impacted. Certain industries, such as travel, restaurants and gyms, are significantly below the profit levels they were before the virus struck. Bankruptcies and business failures, especially among small and medium sized businesses, are taking a toll on workers and their ability to consume in the near future. Certain states are having to shut down again as a result of more rapid spread and the stress on hospital systems in Florida, Texas, Arizona, amongst others. The big banks are taking big writedowns. Stimulus programs run out soon, and although likely, there is no guarantee new programs will be implemented due to political jockeying.

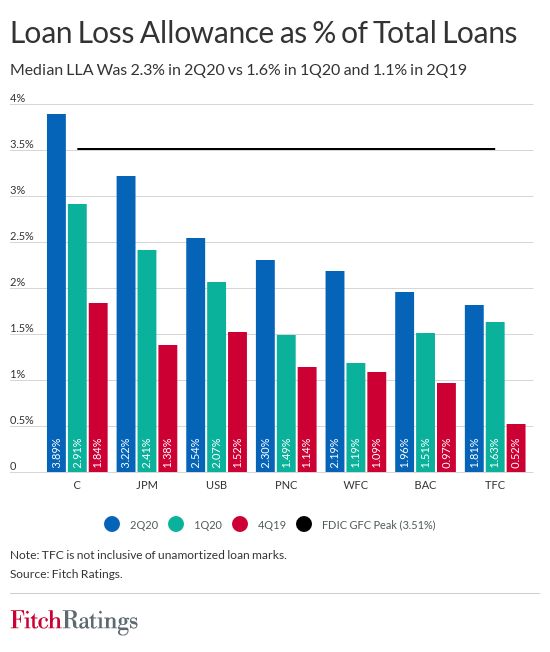
JPMorgan, Citigroup, Wells Fargo and Bank of America last week set aside almost $33 billion for bad loans in the second quarter, up almost $10 billion from last quarter, rising to a level just barely surpassed only once before, during the depths of the financial crisis in the fourth quarter of 2008. The graph below shows the increase in the loan loss provisions reported last week.

As Jamie Dimon, CEO of JP Morgan, said:

“This is not a normal recession. The recessionary part of this you’re going to see down the road. I don’t think anybody should leave any bank earnings call this quarter simply feeling like the worst is absolutely behind us and it’s a rosy path ahead. We don’t want people leaving the call simply thinking the world is a great place and it’s a V-shaped recovery.”

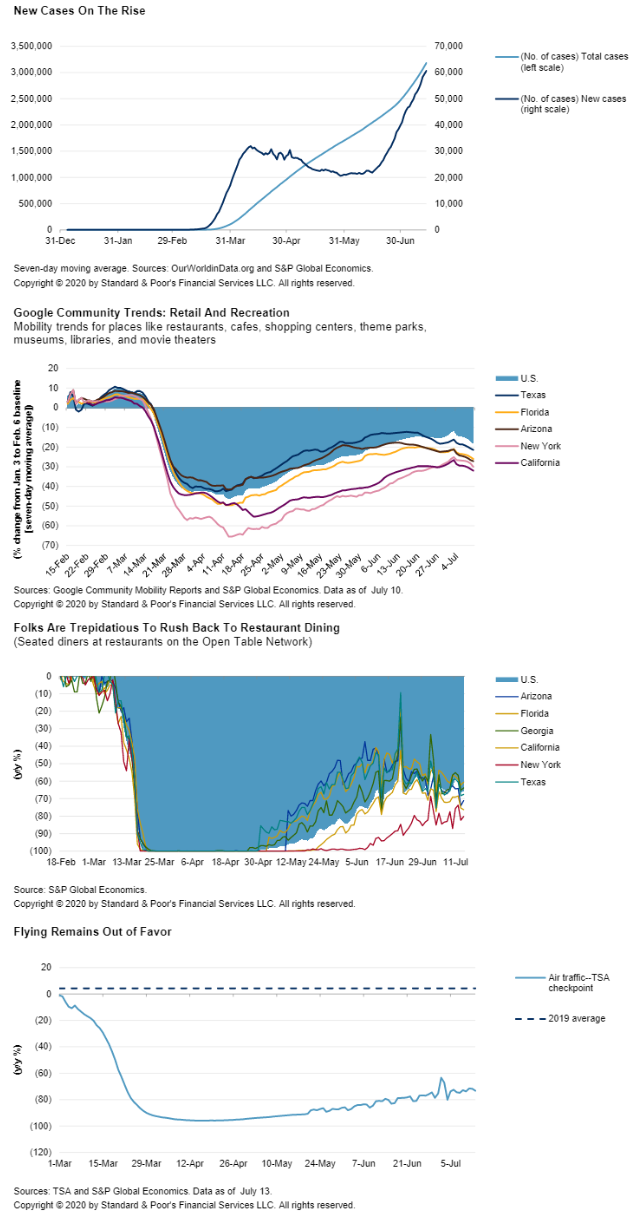
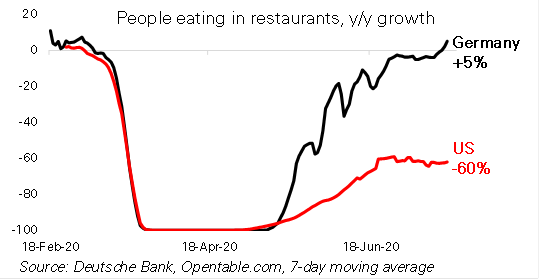
Current mobility data has shown a downturn in economic activity during the last few weeks as cases have spiked. Here are 4 graphs from an S&P report on July 16 regarding cases on the rise and economic activity being impacted in real time.

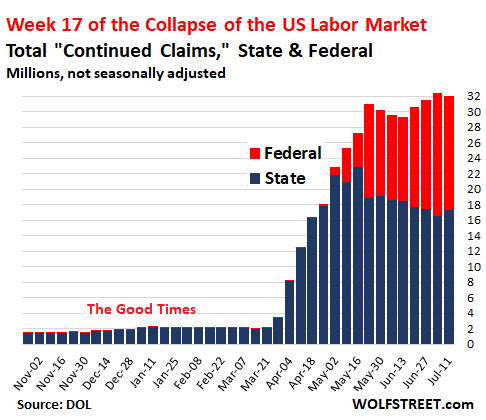
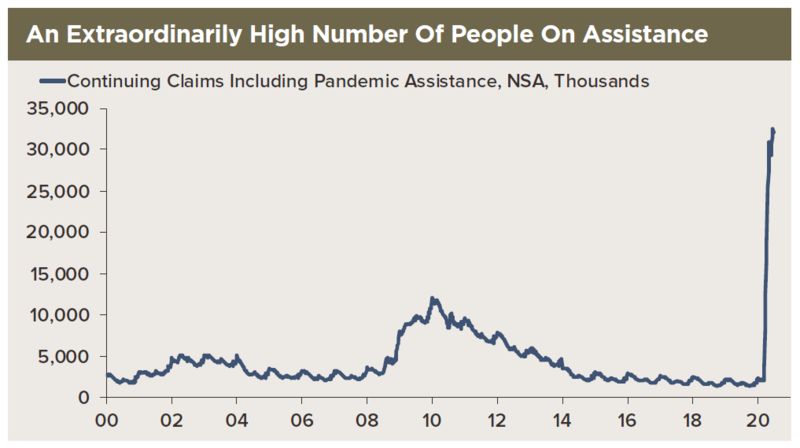
Finally, 32 million people are still receiving some type of unemployment compensation from either a state or Federal program as of July 15.

What should an investor do?

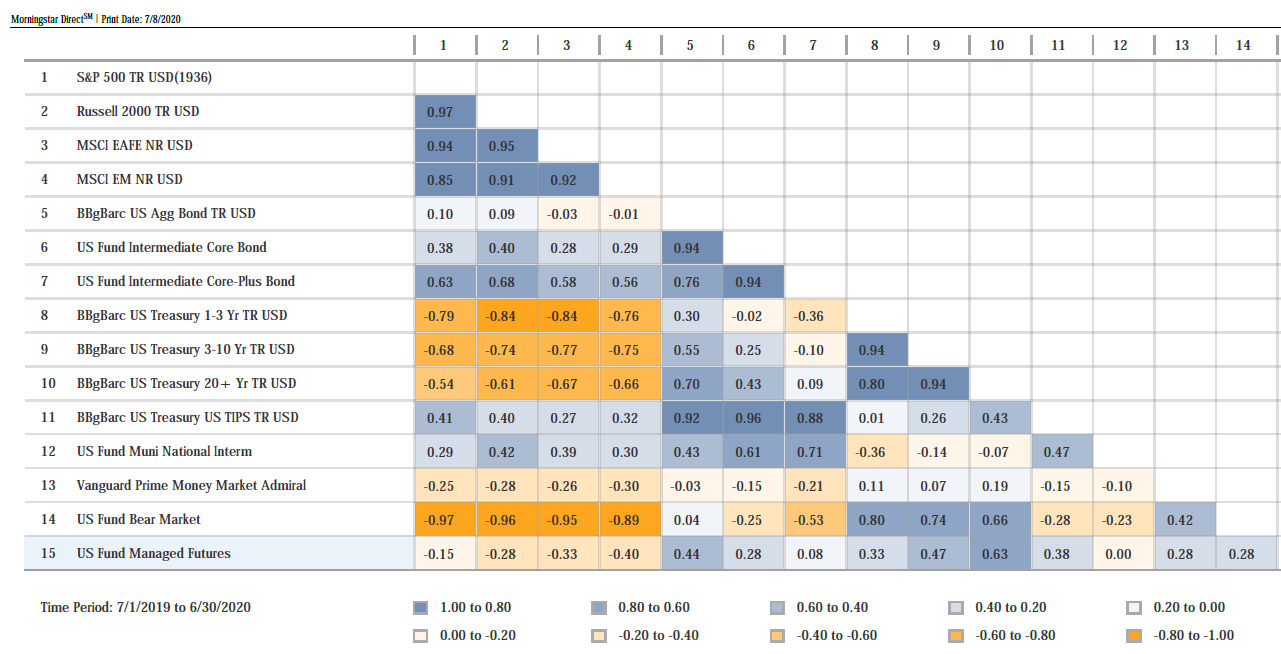
We still believe in BROAD diversification, including assets that are negatively correlated with stocks. That means Treasuries and Mortgage Backed Securities, even though those instruments are not providing much of a yield. As Christine Benz of Morningstar (@christine_benz) wrote on July 8:

“Treasury indexes were the best equity diversifiers among various bond-fund types. But while there’s the widespread perception that long-term Treasuries are the most attractive diversifiers, the recent data don’t bear this out. In fact, the shorter-term Treasury index had an even lower correlation with the S&P 500 than the long-term index. That’s a useful finding, from a portfolio livability standpoint, in that long-term Treasuries are incredibly volatile whereas the shorter-term products are much less so.”

In addition to US Treasuries, we do believe in including some international bonds in the portfolio, as they are also negatively correlated with equities, and they provide protection during stock market declines.

With regard to diversification among equities, we still believe in the “factor” approach for the long-term. That means having a broad worldwide stock market exposure, and then tilting a bit more to (i) small companies, (ii) value companies, (iii) profitable and high quality companies, and (iv) companies that exhibit some short term momentum. All of these factors or dimensions of return have exhibited long-term premiums in the academic literature, and we believe premiums can be captured in low-cost mutual funds or ETFs that target those factors.

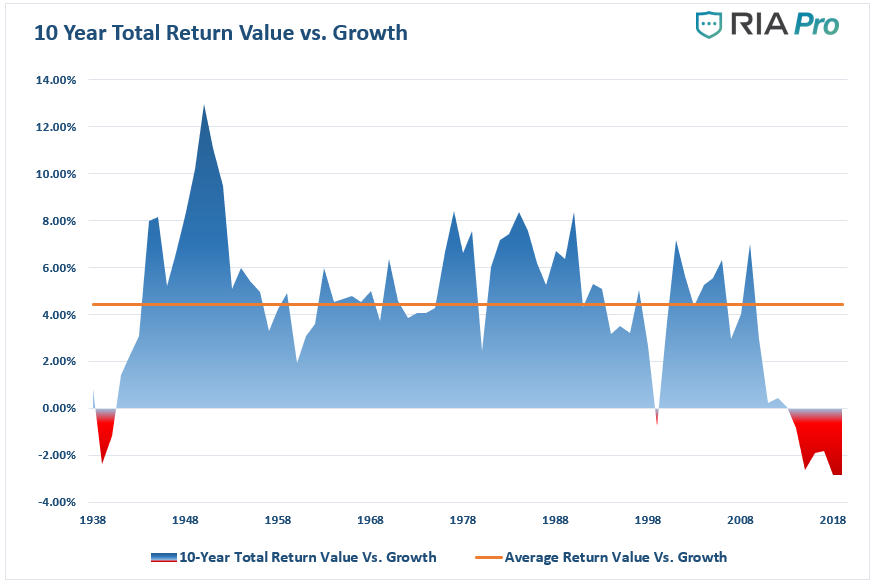
Value has underperformed growth over the past 10 years. However, we believe that the premium still exists, and it makes sense to have exposure to value, as it is at its widest disparity with growth since 1999, right before the tech bubble busted. Why do we believe this?

There are two critical takeaways from the graph above:

  • Over the last 90 years, value stocks have outperformed growth stocks by an average of 4.44% per year (orange line).
  • There have only been eight ten-year periods over the last 90 years (total of 90 ten-year periods) when value stocks underperformed growth stocks. Two of these occurred during the Great Depression and one spanned the 1990s leading into the Tech bust of 2001. The other five are recent, representing the years 2014 through 2019.

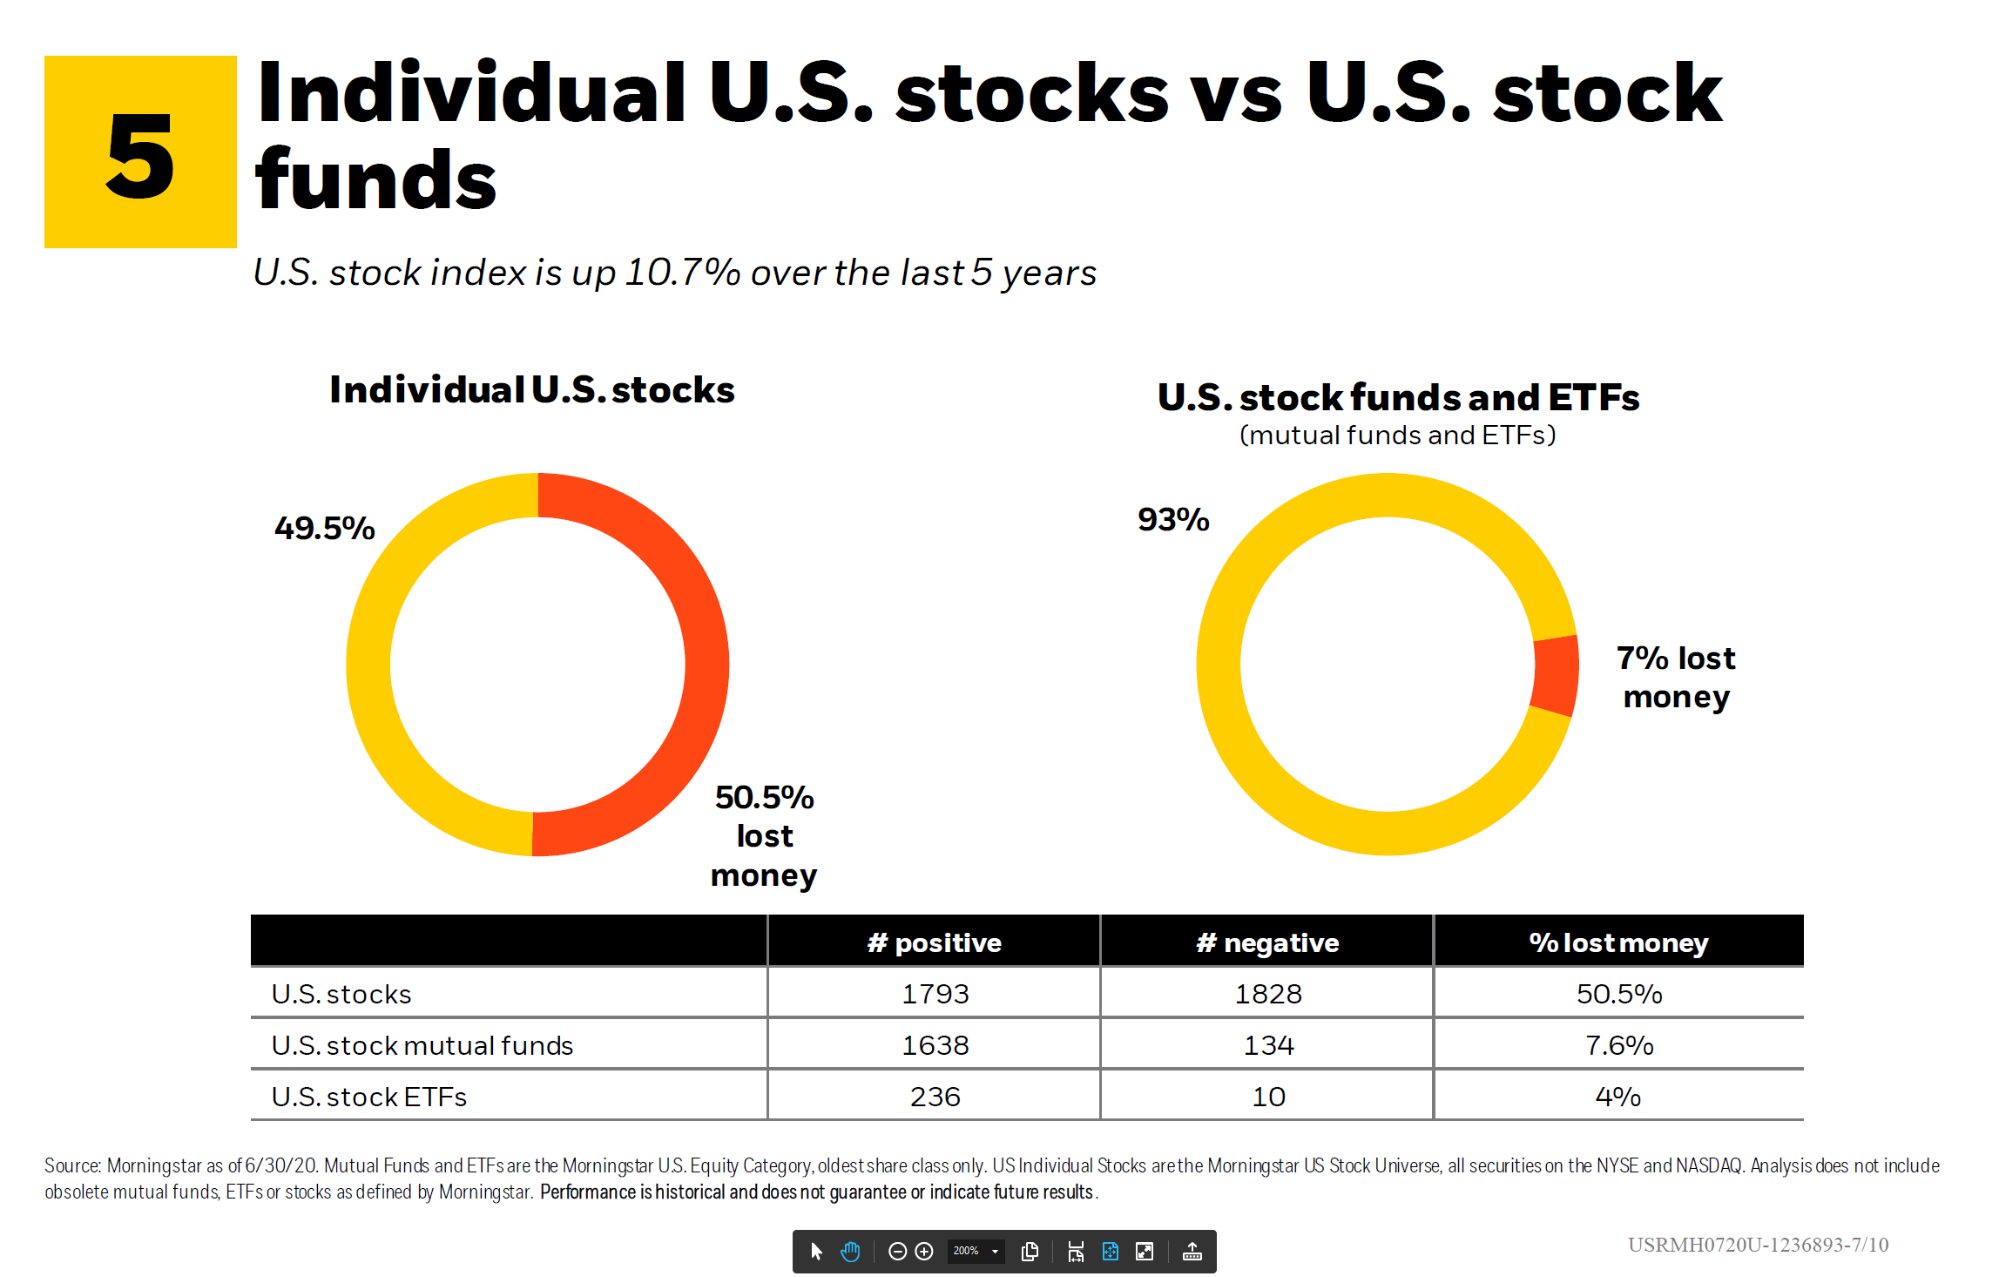
With regard to stock diversification, here is a good slide from BlackRock showing the performance of diversified stock funds versus individual stocks over the past five years. Diversification has benefits.

The risk of stocks is not free. There is still a chance of underperformance. As both Gene Fama and Ken French mention in their paper “Volatility Lessons” from 2018, the odds of having a negative stock market premium (meaning risk free Treasury Bills beat the stock market) are 16% over 10 years, 8% over 20 years, and 4% over 30 years. That shows stocks are risky. There is no way getting around that. Here is Professor Ken French’s site with all of the details on the different premiums over time. https://mba.tuck.dartmouth.edu/pages/faculty/ken.french/data_library.html

In the short term, being exposed to international markets or any of the other factors could lead to some underperformance as compared to the S&P 500 during certain periods of time. However, based upon long-term research, we believe that if investors are patient, the probability is that they will be rewarded with almost equivalent capital market returns at a slightly lower risk due to diversification.

With regard to bonds, we are discussing tweaking our portfolios slightly going forward over time. One change we are contemplating is adding Treasury Inflation Protected Securities (Tips) to the bond allocation. Tips compensate an investor for “unexpected” inflation over time. Regular treasuries price in “expected” inflation. However, if inflation would accelerate, a Tips holder would be compensated for any excess increase in inflation over time, better protecting purchasing power. Inflation adjusted returns are almost always more meaningful than nominal returns. Although the economy appears to be in a potentially deflationary environment right now, there is a fear among some that due to the massive increase in Federal Government debt issuance, a risk exists of inflation arising down the road. We do not know whether that will occur, but by allocating a portion of the bond portfolio to the mix, we would benefit from an increase in unexpected inflation. For a primer on Tips, here is a good link. https://www.pimco.com/en-us/resources/education/understanding-treasury-inflation-protected-securities

Buckle in. I believe we have a long way to go before we get over the Covid hump. We will remain diversified, and make sure your allocation is adequate for your wants, needs and plans. If you’d like to review your plan or anticipate cash needs in the near future please do not hesitate to reach out.

All the best,

Mike and Emily

June 2020 Newsletter

June 12, 2020

“There is general agreement among researchers that nearly all stock pickers, whether they know it or not—and few of them do—are playing a game of chance. The subjective experience of traders is that they are making sensible educated guesses in a situation of great uncertainty. In highly efficient markets, however, educated guesses are no more accurate than blind guesses.”
Daniel Kahneman, Nobel Prize Winner in Economics

“As Nassim Taleb has argued, inadequate appreciation of the uncertainty of the environment inevitably leads economic agents to take risks they should avoid.”
Daniel Kahneman, Nobel Prize Winner in Economics

“An unbiased appreciation of uncertainty is a cornerstone of rationality—but it is not what people and organizations want.”
Daniel Kahneman, Nobel Prize Winner in Economics

“There is something in the human condition that abhors uncertainty, unevenness, unpredictability. People like an average to hold onto, a target to aim at—even if it is a moving target.”
Benoit Mandelbrot, Mathematician

The current market environment has been one of the most difficult I have encountered since taking Portfolio Management and Options and Futures Theory while a graduate student at Indiana University in the 1980’s.

The combination of the worst global pandemic since 1918, a complete shutdown of the economy as a result, the massive flooding of liquidity from the Federal Reserve in historic proportions, and the social unrest arising from the murder of George Floyd in Minnesota, has resulted in great uncertainty and volatility in the markets and the economy.

In the past 2 months, we have either spoken with or participated in webinars with the following:

Gene Fama – https://www.chicagobooth.edu/faculty/directory/f/eugene-f-fama

Robert Shiller – http://www.econ.yale.edu/~shiller/

Ken French – https://mba.tuck.dartmouth.edu/pages/faculty/ken.french/

Ed Lazear – https://www.gsb.stanford.edu/faculty-research/faculty/edward-lazear

Aswath Damodaran – http://pages.stern.nyu.edu/~adamodar/

Jeremy Stein – https://scholar.harvard.edu/stein/home

Sunil Wahal – https://isearch.asu.edu/profile/825492

Meir Statman – https://www.scu.edu/business/finance/faculty/statman/

Rober Novy-Marx – http://rnm.simon.rochester.edu/

In addition, we have had numerous discussions with the fund companies we use.

  • Dimensional Fund Advisors
  • Vanguard
  • BlackRock
  • Avantis
  • Goldman Sachs.

After all these discussions, no one truly knows where the economy and the markets are headed.  The common theme has been the tremendous uncertainty that persists in the economy, markets, and life in general at the present time.

That is why we believe diversification is more important than ever, as having exposure to different asset classes (stocks and bonds) can spread the risk, and hopefully offer a better investment experience over both the short and long-term.  In addition, we believe structuring portfolios to capture long-term expected returns makes the most sense in increasing the odds of a favorable investment experience.  When we talk long-term, we are usually talking about 10-year investment horizons and longer.

There are no guarantees over any investment time horizon, but the more patient one is, the better the odds of having a good experience.

With regard to the current crisis, I want to share with you the latest graph from the Federal Reserve in St. Louis showing the massive increase in the money supply this year.

Here is another view from Schwab.


$3 trillion in M2 money stock has been created in just over 2 months, and it is expected that the Federal Reserve will create even more going forward.  I spoke with my law school classmate and very good friend, who is a distressed debt trader and former bankruptcy lawyer.  His view is that the vast amount of liquidity created by the Federal Reserve has poured into the equity markets, increasing asset prices.  His view may or may not be correct, but due to the massive uncertainty in general, I do not believe his view can be ignored.  The following graph shows that the price to earnings ratio as of June 5 was very high on a historical basis.


Here is a Credit Suisse analysis from June 1, showing the highest forward Price Earnings ratio since the tech bubble of 1999.  Those PEs have come down a bit because of the retracement on June 11, but they are still elevated.


In addition to the Federal Reserve’s increase in the money supply, the Federal Reserve announced on March 23 that they would purchase corporate bonds and corporate bond ETFs such as LQD, and they further announced on April 9 that they would buy “junk” bond ETFs, such as HYG and JNK.  Both actions are unprecedented in the history of the Federal Reserve.

Below is how the S&P 500 responded to those announcements, with a low this year on the date of the Fed’s first announcement of March 23, and a further run-up after the April 9 support of “junk” bonds.


Although the Fed has alleviated some of the liquidity crisis that occurred, there is a question whether such a “bailout”, especially of high-yield “junk” bonds, will encourage even more aggressive risk taking by corporations taking on even more debt, with the bad incentive that such risk taking will be bailed out by the Federal Government in the future if things get worse.  Further, will the Federal Reserve continue to be market participants to a much greater level than they have historically been, and what impact will that have on markets, risk taking, and asset pricing?

We always must keep in mind Gene Fama’s Efficient Markets Hypothesis, which states that “current prices incorporate all available information and expectations.”  That information includes the Federal Reserves’ stimulus mentioned above.  Fama’s hypothesis acknowledges that “mispricings” can occur, but not in predictable patterns that lead to consistent outperformance.  Obviously, by acknowledging mispricings, it is acknowledged that prices are not always “right.”  What it does mean is that prices do give us meaningful information, and that it is extremely difficult, if not impossible, for active strategies to consistently add value through security selection and market timing.  Hence, another reason why a more passive, diversified approach makes a lot of sense.

An example of Fama’s hypothesis at work was Jay Powell’s Fed meeting and press conference on June 10, and the market’s reaction on June 11 to the “new” news.  After digesting details of the meeting, market participants adjusted their valuations of individual companies and the market as a whole.  Powell’s press conference suggested that recovery of employment in the labor market may take longer than was priced in, and in addition to that, it appears that some outbreaks of COVID are occurring or recurring in certain locales in the United States, some at a worrying pace.  The Dow finished down almost 7%, and the S&P 500 down almost 6%.


When volatility spikes, it tends to stay elevated for extended periods of time, sometimes as long as six months.  If a second wave comes in the fall, I would fully expect volatility to climb again, as that would create additional uncertainty, which the market does not like.

No one knows where things are going in the short-term.  If volatility stays elevated as we suspect, there will continue to be large valuation swings, both positive and negative.  Here is a chart showing S&P 500 daily returns for 2020 through the end of the day June 11.  As shown, it is hard to pick any daily pattern.


We believe we have positioned our clients’ portfolios for the long-term.  However, if you believe you have more risk than you can stomach, please do not hesitate to call us.  We are happy to discuss with you and develop a portfolio that is appropriate for both your financial plan and your peace of mind.

All the best,

Mike and Emily

April 2020 Newsletter

May 1, 2020

“Everyone has a plan until they get punched in the mouth.”
Mike Tyson, Former Heavyweight Boxer

“The important thing about an investment philosophy is that you have one you can stick with.”
David Booth, Chairman, Dimensional Fund Advisors Read more

COVID-19 Update

March 29, 2020

This is a very difficult time with the COVID-19 pandemic percolating. We hope you are all safe and handling this in the best possible manner. Read more

Coronavirus – McCartney Wealth Management Newsletter

February 25, 2020

“I know that history is going to be dominated by an improbable event, I just don’t know what that event will be.”
Nassim Nicholas Taleb, The Black Swan

 “We are effectively not skilled at intuitively gauging the impact of the improbable.”
Nassim Nicholas Taleb, The Black Swan

 “These are models. And the reason we call them models is that they’re not 100 percent true. If they were, we would call them reality, not models. They’re simplifications. But the acid test is, How good are the simplifications for your purposes? And for almost all purposes, market efficiency is a very good approximation. There is very little evidence that money managers can beat the market.”
Gene Fama

 “Staying rich requires an entirely different approach from getting rich.  It might be said that one gets rich by working hard and taking big risks, and that one stays rich by limiting risk and not spending too much.”
Aswath Damodaran and Peter Bernstein

 “The greatest shortcoming of the human race is our inability to understand the exponential function.”
Albert Allen Bartlett

I want to reach out in regard to the coronavirus and markets.  I want to first emphasize that this is not a panic laden newsletter.  However, I continuously emphasize that we manage both return and risk.  One way we measure risk is by variance or standard deviation. Another way we can think about risk is one of minimizing losses and preservation of capital.

In my entire career in the investment adviser space, I’ve not recommended market timing.  I’ve been following the coronavirus situation closely. I have not really been following what the market participants have been saying, but I’ve been following the leading epidemiologists in the world and their perspective.

Their consistent view is that the virus can no longer be contained.  Marc Lipsitch, the Harvard epidemiology professor said yesterday: “I think the likely outcome is that it will ultimately not be containable.”  Neil Ferguson and colleagues at Imperial College London estimate that about two thirds of coronavirus cases exported from mainland China have gone undetected worldwide.

This is not a reason to panic, but it is good to plan.  There is definitely some downside risk that supply chains and business will slow down for a while.  There is also the possibility that a vaccine is found or that central banks are able to manage the situation.  Because markets are a complex system with no one cause for movement, it is virtually impossible to predict what will happen, especially in the short-term.

Valuations of stocks are nothing more than the discounted cash future cash flows of a company (and for the market, discounted future cash flows in the aggregate), and those are discounted by an appropriate discount rate.

If those cash flows decrease, holding the discount rate constant, you will have a reduction in the value of both individual stocks and markets as a whole.  The discount rate is important, as central banks will most likely try to reduce that, and we do not know if the central bank function will offset the lessening of discounted future cash flows, if that should occur.

The market does a good job pricing in those changes in expectations.  As Gene Fama and Ken French say in their July 14, 2009, post:

 “During the financial crisis, some investors discovered that their tolerance for risk is lower than they thought, so it might make sense for them to permanently reduce their exposure to equities. Investors who wish to avoid the price impact of the recession, however, are probably too late. Today’s stock prices already reflect the anticipated effects of the slowdown, as well as any effects the recession has on expected future returns.”

We still believe in a long term view and approach to investing in the stock market.  However, if you have a large amount of stock risk and your tolerance for risk may be lower than you originally thought, you could suffer relatively large losses in the short to intermediate term.  If you have significant cash needs in the next year, or you were concerned about a significant reduction in the value of your portfolio, and you have greater than 60% of your portfolio in stocks, we think it is worthwhile to discuss the situation.  Many of our clients actually hold 60% or less of their portfolio in stocks. We’re comfortable with this long-term approach as long as you don’t have any significant cash needs in the next year.

Historically, when volatility kicks up, it remains around for some time.  As Benoit Mandelbrot wrote in The Misbehavior of Markets, “volatility clusters.”

Our good friend Eduardo Repetto and his former colleague, L. Jacobo Rodriguez, wrote a very good paper entitled “Market Anxiety” in 2008.  In it, they found:

  • It was not unusual to find that periods of extreme negative performance have “historically been periods of higher than average volatility and higher than average cross sectional dispersion.”
  • Volatility and cross-sectional dispersion are likely to continue in the short run (because they are autocorrelated, which we will not elaborate on).
  • However, neither volatility nor dispersion predicts future returns, positive or negative.  This is a very important point!
  • Returns in the semesters and years following  semesters and years of extreme negative performance have been on average positive.
  • Realized risk premiums are not reliably negative during economic recessions.
  • Attempts to time allocations to risky assets at different stages of the business cycles are likely to be futile and only bring about an increase in transaction costs.

Repetto concludes with the following:

“Volatility and cross-sectional dispersion bring uncertainty, which in turn brings anxiety. The best way to mitigate that uncertainty is to be broadly diversified within and across asset classes at all times, so that investors need not worry about whether they own the stocks that earn the returns of those asset classes or whether they are fully invested in the markets when they turn.”  For all of our clients, we use very broadly diversified portfolios.

McCartney Wealth Management does believe in a passive approach to investing.  We do not know where the markets are going in the short to intermediate term due to market volatility, but we have a strong belief that markets will be positive in the long term.

We do think it makes sense to alert investors and clients when the health experts are concerned about a global pandemic and manage the expectations of clients with the possible downside risks in the market.

Below are a few links to some of the people we’re following to assist us in our analysis.(Twitter handles).

Professor Marc Lipsitch – Harvard – @mlipsitch
Professor Neil Ferguson – Imperial College London – @neil_ferguson
Professor Ian Mackay – @MackayIM

Please reach out with any questions.